RegenxbioInc RGNX full analysis,charts,indicators,moving averages,SMA,DMA,EMA,ADX,MACD,RSIRegenxbio Inc RGNX WideScreen charts, DMA,SMA,EMA technical analysis, forecast prediction, by indicators ADX,MACD,RSI,CCI USA stock exchange
operates under Health Care sector & deals in Biotechnology Biological Products No Diagnostic Substances
Daily price and charts and targets RegenxbioInc Strong Daily Stock price targets for RegenxbioInc RGNX are 12.9 and 13.85 | Daily Target 1 | 12.24 | | Daily Target 2 | 12.61 | | Daily Target 3 | 13.19 | | Daily Target 4 | 13.56 | | Daily Target 5 | 14.14 |
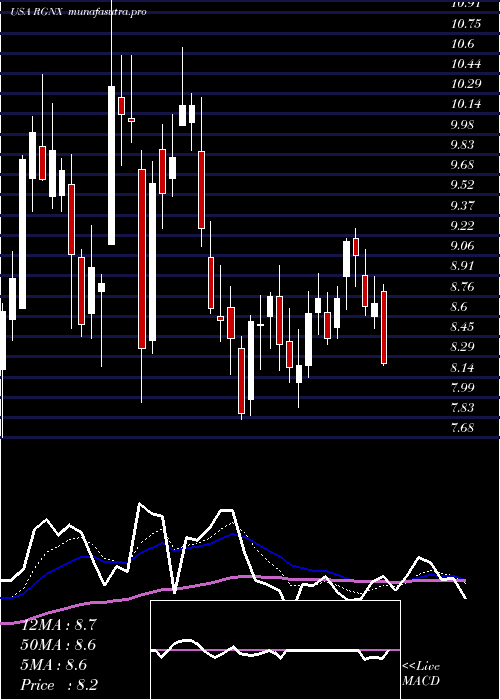
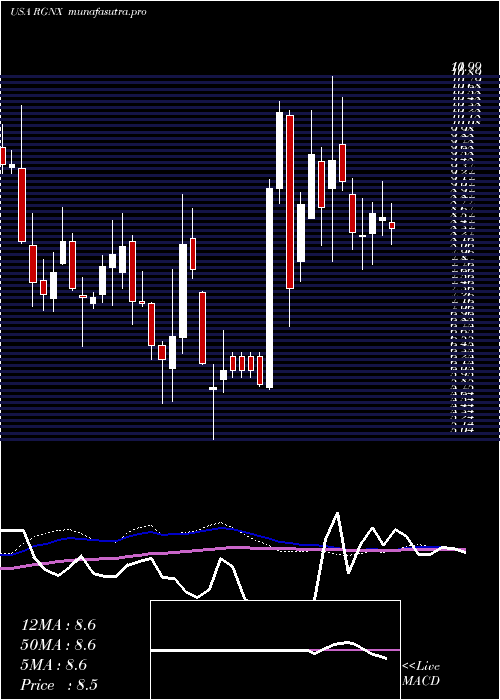
Daily price and volume Regenxbio Inc
| Date |
Closing |
Open |
Range |
Volume |
Thu 04 December 2025 |
12.98 (0.78%) |
12.88 |
12.82 - 13.77 |
1.5486 times |
Wed 03 December 2025 |
12.88 (5.49%) |
12.22 |
12.21 - 12.93 |
0.7529 times |
Tue 02 December 2025 |
12.21 (-3.1%) |
12.70 |
12.05 - 12.90 |
0.8939 times |
Mon 01 December 2025 |
12.60 (-5.9%) |
13.00 |
12.42 - 13.24 |
0.8618 times |
Fri 28 November 2025 |
13.39 (1.06%) |
13.25 |
13.01 - 13.39 |
1.8058 times |
Wed 26 November 2025 |
13.25 (-1.63%) |
13.70 |
13.11 - 13.80 |
0.6684 times |
Tue 25 November 2025 |
13.47 (10.14%) |
12.24 |
12.04 - 13.65 |
0.7991 times |
Mon 24 November 2025 |
12.23 (3.64%) |
11.87 |
11.81 - 12.50 |
1.1913 times |
Fri 21 November 2025 |
11.80 (8.56%) |
10.87 |
10.76 - 11.97 |
0.7457 times |
Thu 20 November 2025 |
10.87 (-0.55%) |
11.18 |
10.83 - 11.58 |
0.7325 times |
Wed 19 November 2025 |
10.93 (-2.84%) |
11.04 |
10.82 - 11.30 |
0.9639 times |
Weekly price and charts RegenxbioInc Strong weekly Stock price targets for RegenxbioInc RGNX are 11.66 and 13.38 | Weekly Target 1 | 11.21 | | Weekly Target 2 | 12.1 | | Weekly Target 3 | 12.933333333333 | | Weekly Target 4 | 13.82 | | Weekly Target 5 | 14.65 |
Weekly price and volumes for Regenxbio Inc
| Date |
Closing |
Open |
Range |
Volume |
Thu 04 December 2025 |
12.98 (-3.06%) |
13.00 |
12.05 - 13.77 |
1.0108 times |
Fri 28 November 2025 |
13.39 (13.47%) |
11.87 |
11.81 - 13.80 |
1.1122 times |
Fri 21 November 2025 |
11.80 (2.52%) |
11.45 |
10.70 - 11.97 |
1.0466 times |
Fri 14 November 2025 |
11.51 (2.68%) |
11.65 |
10.86 - 12.05 |
1.0683 times |
Fri 07 November 2025 |
11.21 (-12.22%) |
11.42 |
10.80 - 11.96 |
0.956 times |
Fri 31 October 2025 |
12.77 (0%) |
12.82 |
12.61 - 13.20 |
0.1943 times |
Fri 31 October 2025 |
12.77 (-2%) |
13.44 |
12.61 - 13.93 |
0.9695 times |
Fri 24 October 2025 |
13.03 (11.08%) |
12.34 |
12.02 - 13.45 |
0.9602 times |
Fri 17 October 2025 |
11.73 (7.42%) |
11.33 |
10.90 - 12.99 |
1.0719 times |
Fri 10 October 2025 |
10.92 (4.7%) |
10.68 |
10.24 - 12.84 |
1.6101 times |
Fri 03 October 2025 |
10.43 (8.08%) |
9.74 |
9.55 - 11.00 |
1.3731 times |
Monthly price and charts RegenxbioInc Strong monthly Stock price targets for RegenxbioInc RGNX are 11.66 and 13.38 | Monthly Target 1 | 11.21 | | Monthly Target 2 | 12.1 | | Monthly Target 3 | 12.933333333333 | | Monthly Target 4 | 13.82 | | Monthly Target 5 | 14.65 |
Monthly price and volumes Regenxbio Inc
| Date |
Closing |
Open |
Range |
Volume |
Thu 04 December 2025 |
12.98 (-3.06%) |
13.00 |
12.05 - 13.77 |
0.1616 times |
Fri 28 November 2025 |
13.39 (4.86%) |
11.42 |
10.70 - 13.80 |
0.6689 times |
Fri 31 October 2025 |
12.77 (32.33%) |
9.57 |
9.55 - 13.93 |
0.8823 times |
Tue 30 September 2025 |
9.65 (8.06%) |
8.75 |
8.68 - 10.17 |
0.6712 times |
Fri 29 August 2025 |
8.93 (4.94%) |
8.24 |
7.35 - 9.25 |
0.9483 times |
Thu 31 July 2025 |
8.51 (3.65%) |
8.10 |
7.91 - 9.32 |
0.8686 times |
Mon 30 June 2025 |
8.21 (-7.23%) |
9.15 |
7.82 - 11.00 |
1.431 times |
Fri 30 May 2025 |
8.85 (-7.91%) |
9.60 |
6.89 - 10.59 |
1.7474 times |
Wed 30 April 2025 |
9.61 (34.41%) |
7.18 |
5.04 - 9.72 |
1.333 times |
Mon 31 March 2025 |
7.15 (8.83%) |
6.57 |
5.62 - 9.06 |
1.2876 times |
Fri 28 February 2025 |
6.57 (-18.59%) |
7.77 |
6.34 - 8.75 |
0.9161 times |
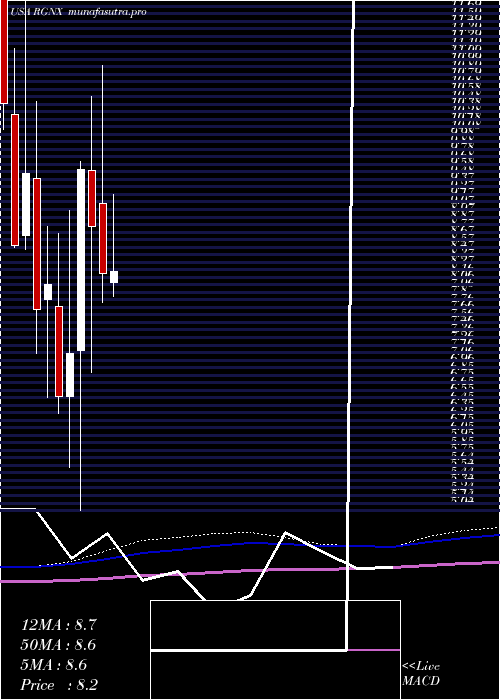
DMA SMA EMA moving averages of Regenxbio Inc RGNX
DMA (daily moving average) of Regenxbio Inc RGNX
| DMA period | DMA value | | 5 day DMA | 12.81 | | 12 day DMA | 12.32 | | 20 day DMA | 11.94 | | 35 day DMA | 12.21 | | 50 day DMA | 11.77 | | 100 day DMA | 10.3 | | 150 day DMA | 9.84 | | 200 day DMA | 9.12 | EMA (exponential moving average) of Regenxbio Inc RGNX
| EMA period | EMA current | EMA prev | EMA prev2 | | 5 day EMA | 12.78 | 12.68 | 12.58 | | 12 day EMA | 12.48 | 12.39 | 12.3 | | 20 day EMA | 12.27 | 12.19 | 12.12 | | 35 day EMA | 11.89 | 11.83 | 11.77 | | 50 day EMA | 11.65 | 11.6 | 11.55 |
SMA (simple moving average) of Regenxbio Inc RGNX
| SMA period | SMA current | SMA prev | SMA prev2 | | 5 day SMA | 12.81 | 12.87 | 12.98 | | 12 day SMA | 12.32 | 12.17 | 12.05 | | 20 day SMA | 11.94 | 11.87 | 11.8 | | 35 day SMA | 12.21 | 12.19 | 12.15 | | 50 day SMA | 11.77 | 11.7 | 11.62 | | 100 day SMA | 10.3 | 10.25 | 10.21 | | 150 day SMA | 9.84 | 9.82 | 9.8 | | 200 day SMA | 9.12 | 9.09 | 9.07 |
|
|
