RoyalGold RGLD full analysis,charts,indicators,moving averages,SMA,DMA,EMA,ADX,MACD,RSIRoyal Gold RGLD WideScreen charts, DMA,SMA,EMA technical analysis, forecast prediction, by indicators ADX,MACD,RSI,CCI USA stock exchange
operates under Basic Industries sector & deals in Precious Metals
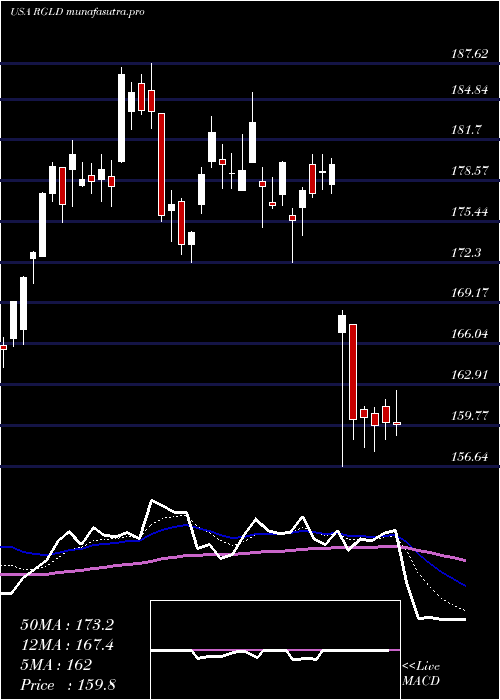
Daily price and charts and targets RoyalGold Strong Daily Stock price targets for RoyalGold RGLD are 193.91 and 200.15 | Daily Target 1 | 189.7 | | Daily Target 2 | 191.88 | | Daily Target 3 | 195.94 | | Daily Target 4 | 198.12 | | Daily Target 5 | 202.18 |
Daily price and volume Royal Gold
| Date |
Closing |
Open |
Range |
Volume |
Mon 20 October 2025 |
194.06 (0.15%) |
193.77 |
193.76 - 200.00 |
0.5176 times |
Fri 17 October 2025 |
193.76 (-6.24%) |
203.40 |
193.08 - 203.98 |
3.6904 times |
Thu 16 October 2025 |
206.65 (2.18%) |
202.64 |
201.96 - 209.42 |
0.97 times |
Wed 15 October 2025 |
202.24 (1.28%) |
202.01 |
199.79 - 203.78 |
0.8226 times |
Tue 14 October 2025 |
199.68 (0.11%) |
197.97 |
196.31 - 204.08 |
0.8215 times |
Mon 13 October 2025 |
199.47 (2.57%) |
198.77 |
196.56 - 201.11 |
0.4783 times |
Fri 10 October 2025 |
194.47 (0.9%) |
193.59 |
192.16 - 195.67 |
0.5206 times |
Thu 09 October 2025 |
192.73 (-6.09%) |
206.00 |
190.51 - 206.49 |
0.7679 times |
Wed 08 October 2025 |
205.23 (3.66%) |
201.66 |
198.39 - 205.39 |
0.6817 times |
Tue 07 October 2025 |
197.99 (-2.95%) |
204.41 |
196.73 - 204.88 |
0.7295 times |
Mon 06 October 2025 |
204.00 (1.83%) |
203.29 |
202.50 - 206.68 |
0.4021 times |
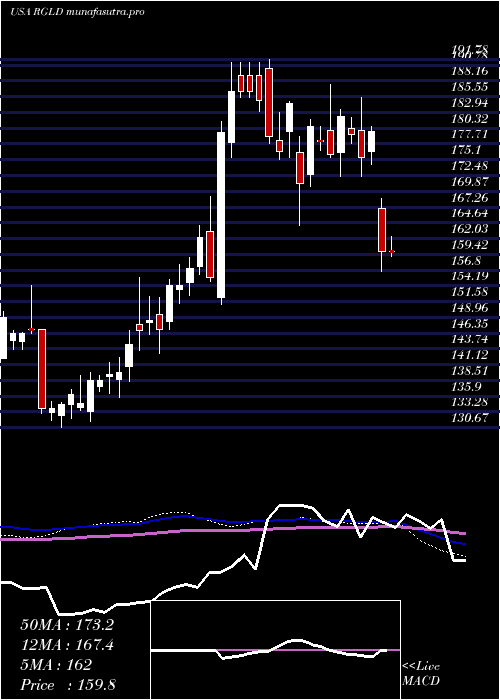
Weekly price and charts RoyalGold Strong weekly Stock price targets for RoyalGold RGLD are 193.91 and 200.15 | Weekly Target 1 | 189.7 | | Weekly Target 2 | 191.88 | | Weekly Target 3 | 195.94 | | Weekly Target 4 | 198.12 | | Weekly Target 5 | 202.18 |
Weekly price and volumes for Royal Gold
| Date |
Closing |
Open |
Range |
Volume |
Mon 20 October 2025 |
194.06 (0.15%) |
193.77 |
193.76 - 200.00 |
0.184 times |
Fri 17 October 2025 |
193.76 (-0.37%) |
198.77 |
193.08 - 209.42 |
2.4115 times |
Fri 10 October 2025 |
194.47 (-2.93%) |
203.29 |
190.51 - 206.68 |
1.1027 times |
Fri 03 October 2025 |
200.34 (1.85%) |
200.00 |
193.21 - 203.18 |
1.0416 times |
Fri 26 September 2025 |
196.71 (2.63%) |
195.00 |
188.45 - 198.13 |
1.1836 times |
Fri 19 September 2025 |
191.67 (1.24%) |
190.48 |
183.58 - 196.00 |
1.7832 times |
Fri 12 September 2025 |
189.32 (2.41%) |
187.61 |
183.85 - 191.13 |
0.7289 times |
Fri 05 September 2025 |
184.86 (2.94%) |
181.08 |
177.62 - 185.68 |
0.7297 times |
Fri 29 August 2025 |
179.58 (0%) |
176.40 |
176.14 - 180.20 |
0.1496 times |
Fri 29 August 2025 |
179.58 (1.21%) |
177.35 |
174.02 - 180.20 |
0.6852 times |
Fri 22 August 2025 |
177.44 (3.49%) |
171.00 |
166.51 - 177.78 |
0.7236 times |
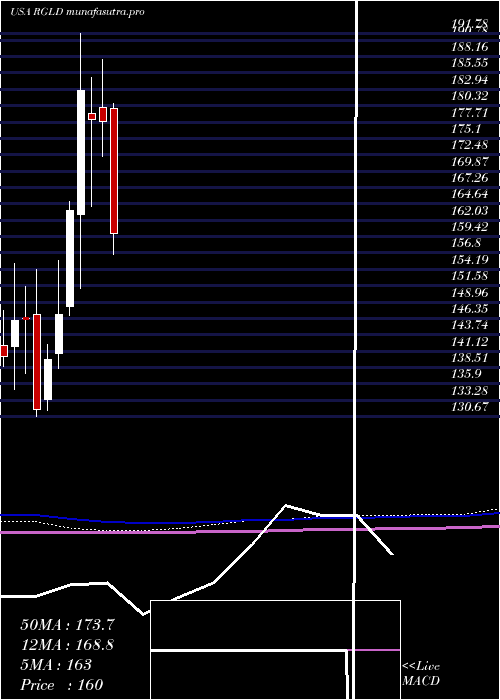
Monthly price and charts RoyalGold Strong monthly Stock price targets for RoyalGold RGLD are 182.83 and 201.74 | Monthly Target 1 | 179.09 | | Monthly Target 2 | 186.57 | | Monthly Target 3 | 197.99666666667 | | Monthly Target 4 | 205.48 | | Monthly Target 5 | 216.91 |
Monthly price and volumes Royal Gold
| Date |
Closing |
Open |
Range |
Volume |
Mon 20 October 2025 |
194.06 (-3.25%) |
201.50 |
190.51 - 209.42 |
1.364 times |
Tue 30 September 2025 |
200.58 (11.69%) |
181.08 |
177.62 - 202.38 |
1.5582 times |
Fri 29 August 2025 |
179.58 (18.6%) |
154.67 |
151.50 - 180.20 |
1.1654 times |
Thu 31 July 2025 |
151.42 (-14.86%) |
179.84 |
150.75 - 180.62 |
1.4842 times |
Mon 30 June 2025 |
177.84 (-0.16%) |
180.02 |
172.29 - 187.62 |
0.7735 times |
Fri 30 May 2025 |
178.12 (-2.51%) |
179.06 |
164.20 - 184.76 |
0.7333 times |
Wed 30 April 2025 |
182.71 (11.74%) |
163.02 |
151.10 - 191.78 |
1.0389 times |
Mon 31 March 2025 |
163.51 (11.23%) |
148.29 |
146.88 - 164.96 |
0.6596 times |
Fri 28 February 2025 |
147.00 (5.14%) |
140.74 |
138.34 - 155.64 |
0.6425 times |
Fri 31 January 2025 |
139.82 (6.04%) |
133.36 |
131.73 - 142.24 |
0.5805 times |
Tue 31 December 2024 |
131.85 (-9.88%) |
147.01 |
130.67 - 154.18 |
0.4351 times |
DMA SMA EMA moving averages of Royal Gold RGLD
DMA (daily moving average) of Royal Gold RGLD
| DMA period | DMA value | | 5 day DMA | 199.28 | | 12 day DMA | 199.22 | | 20 day DMA | 198 | | 35 day DMA | 193.44 | | 50 day DMA | 187.62 | | 100 day DMA | 178.3 | | 150 day DMA | 176.47 | | 200 day DMA | 168.26 | EMA (exponential moving average) of Royal Gold RGLD
| EMA period | EMA current | EMA prev | EMA prev2 | | 5 day EMA | 197.55 | 199.3 | 202.07 | | 12 day EMA | 198.08 | 198.81 | 199.73 | | 20 day EMA | 196.64 | 196.91 | 197.24 | | 35 day EMA | 192.02 | 191.9 | 191.79 | | 50 day EMA | 186.92 | 186.63 | 186.34 |
SMA (simple moving average) of Royal Gold RGLD
| SMA period | SMA current | SMA prev | SMA prev2 | | 5 day SMA | 199.28 | 200.36 | 200.5 | | 12 day SMA | 199.22 | 199.62 | 200.15 | | 20 day SMA | 198 | 197.87 | 197.76 | | 35 day SMA | 193.44 | 193.03 | 192.63 | | 50 day SMA | 187.62 | 187.15 | 186.65 | | 100 day SMA | 178.3 | 178.14 | 178.01 | | 150 day SMA | 176.47 | 176.2 | 175.93 | | 200 day SMA | 168.26 | 167.95 | 167.63 |
|
|
