RexfordIndustrial REXR full analysis,charts,indicators,moving averages,SMA,DMA,EMA,ADX,MACD,RSIRexford Industrial REXR WideScreen charts, DMA,SMA,EMA technical analysis, forecast prediction, by indicators ADX,MACD,RSI,CCI USA stock exchange
operates under Consumer Services sector & deals in Real Estate Investment Trusts
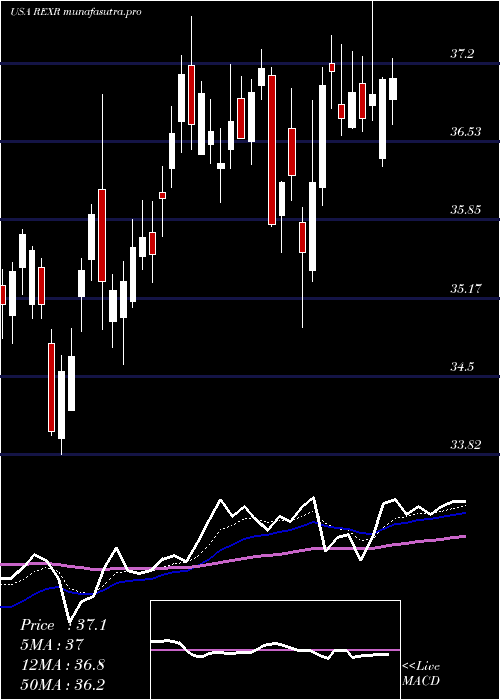
Daily price and charts and targets RexfordIndustrial Strong Daily Stock price targets for RexfordIndustrial REXR are 40.4 and 41.01 | Daily Target 1 | 40.29 | | Daily Target 2 | 40.51 | | Daily Target 3 | 40.9 | | Daily Target 4 | 41.12 | | Daily Target 5 | 41.51 |
Daily price and volume Rexford Industrial
| Date |
Closing |
Open |
Range |
Volume |
Fri 05 December 2025 |
40.73 (-1.12%) |
41.11 |
40.68 - 41.29 |
1.1665 times |
Thu 04 December 2025 |
41.19 (-1.08%) |
41.59 |
41.14 - 41.71 |
0.829 times |
Wed 03 December 2025 |
41.64 (0.97%) |
41.17 |
41.00 - 41.66 |
1.1464 times |
Tue 02 December 2025 |
41.24 (-0.53%) |
41.55 |
41.22 - 41.74 |
1.0401 times |
Mon 01 December 2025 |
41.46 (-0.36%) |
41.20 |
41.09 - 41.76 |
0.9877 times |
Fri 28 November 2025 |
41.61 (-0.12%) |
41.82 |
41.57 - 41.93 |
0.4641 times |
Wed 26 November 2025 |
41.66 (0.65%) |
41.46 |
41.40 - 42.06 |
0.59 times |
Tue 25 November 2025 |
41.39 (1.4%) |
40.82 |
40.71 - 41.77 |
1.5743 times |
Mon 24 November 2025 |
40.82 (-0.54%) |
41.07 |
40.62 - 41.33 |
0.9077 times |
Fri 21 November 2025 |
41.04 (1.94%) |
40.33 |
40.09 - 41.18 |
1.2943 times |
Thu 20 November 2025 |
40.26 (0.15%) |
40.52 |
40.22 - 41.05 |
1.1459 times |
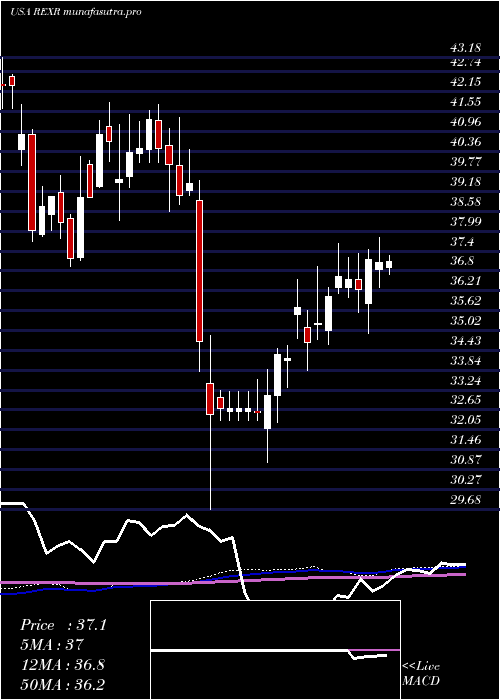
Weekly price and charts RexfordIndustrial Strong weekly Stock price targets for RexfordIndustrial REXR are 40.17 and 41.25 | Weekly Target 1 | 39.98 | | Weekly Target 2 | 40.35 | | Weekly Target 3 | 41.056666666667 | | Weekly Target 4 | 41.43 | | Weekly Target 5 | 42.14 |
Weekly price and volumes for Rexford Industrial
| Date |
Closing |
Open |
Range |
Volume |
Fri 05 December 2025 |
40.73 (-2.11%) |
41.20 |
40.68 - 41.76 |
1.1437 times |
Fri 28 November 2025 |
41.61 (1.39%) |
41.07 |
40.62 - 42.06 |
0.7823 times |
Fri 21 November 2025 |
41.04 (0.12%) |
41.02 |
39.81 - 42.41 |
1.543 times |
Fri 14 November 2025 |
40.99 (-2.03%) |
41.98 |
40.80 - 42.25 |
0.5758 times |
Fri 07 November 2025 |
41.84 (1.26%) |
41.24 |
40.73 - 41.84 |
0.6006 times |
Fri 31 October 2025 |
41.32 (0%) |
41.13 |
40.74 - 41.37 |
0.2769 times |
Fri 31 October 2025 |
41.32 (-2.09%) |
42.50 |
40.74 - 42.66 |
1.0131 times |
Fri 24 October 2025 |
42.20 (-3.56%) |
43.39 |
42.12 - 44.38 |
1.2619 times |
Fri 17 October 2025 |
43.76 (11.18%) |
39.89 |
39.67 - 43.78 |
1.8144 times |
Fri 10 October 2025 |
39.36 (-5.54%) |
41.82 |
39.34 - 42.10 |
0.9884 times |
Fri 03 October 2025 |
41.67 (0.22%) |
41.77 |
40.76 - 41.96 |
1.2742 times |
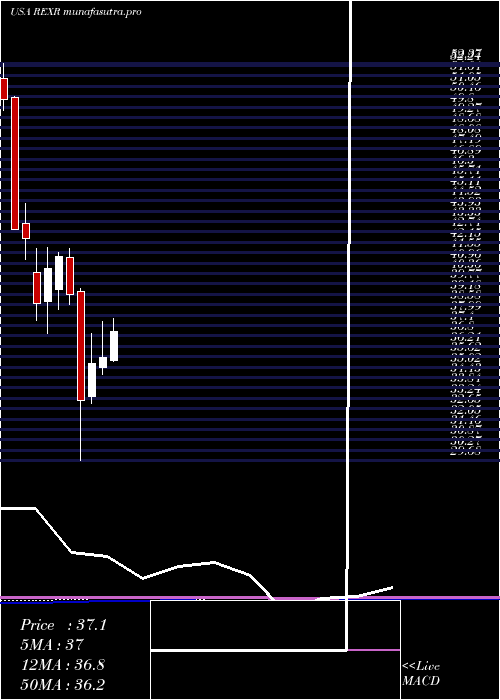
Monthly price and charts RexfordIndustrial Strong monthly Stock price targets for RexfordIndustrial REXR are 40.17 and 41.25 | Monthly Target 1 | 39.98 | | Monthly Target 2 | 40.35 | | Monthly Target 3 | 41.056666666667 | | Monthly Target 4 | 41.43 | | Monthly Target 5 | 42.14 |
Monthly price and volumes Rexford Industrial
| Date |
Closing |
Open |
Range |
Volume |
Fri 05 December 2025 |
40.73 (-2.11%) |
41.20 |
40.68 - 41.76 |
0.2021 times |
Fri 28 November 2025 |
41.61 (0.7%) |
41.24 |
39.81 - 42.41 |
0.6187 times |
Fri 31 October 2025 |
41.32 (0.51%) |
41.30 |
39.34 - 44.38 |
1.0731 times |
Tue 30 September 2025 |
41.11 (-0.72%) |
40.75 |
40.06 - 43.79 |
1.2101 times |
Fri 29 August 2025 |
41.41 (13.36%) |
36.68 |
35.53 - 42.65 |
1.0209 times |
Thu 31 July 2025 |
36.53 (2.7%) |
35.41 |
35.12 - 38.18 |
1.4286 times |
Mon 30 June 2025 |
35.57 (0.94%) |
35.01 |
34.60 - 37.61 |
1.0714 times |
Fri 30 May 2025 |
35.24 (6.47%) |
33.33 |
32.96 - 36.93 |
1.1234 times |
Wed 30 April 2025 |
33.10 (-15.45%) |
39.32 |
29.68 - 39.49 |
1.2595 times |
Mon 31 March 2025 |
39.15 (-5.25%) |
41.28 |
38.58 - 41.78 |
0.9922 times |
Fri 28 February 2025 |
41.32 (1.62%) |
39.45 |
38.32 - 41.59 |
0.8471 times |
DMA SMA EMA moving averages of Rexford Industrial REXR
DMA (daily moving average) of Rexford Industrial REXR
| DMA period | DMA value | | 5 day DMA | 41.25 | | 12 day DMA | 41.1 | | 20 day DMA | 41.2 | | 35 day DMA | 41.64 | | 50 day DMA | 41.57 | | 100 day DMA | 40.61 | | 150 day DMA | 39.01 | | 200 day DMA | 38.47 | EMA (exponential moving average) of Rexford Industrial REXR
| EMA period | EMA current | EMA prev | EMA prev2 | | 5 day EMA | 41.14 | 41.35 | 41.43 | | 12 day EMA | 41.2 | 41.28 | 41.3 | | 20 day EMA | 41.25 | 41.31 | 41.32 | | 35 day EMA | 41.39 | 41.43 | 41.44 | | 50 day EMA | 41.56 | 41.59 | 41.61 |
SMA (simple moving average) of Rexford Industrial REXR
| SMA period | SMA current | SMA prev | SMA prev2 | | 5 day SMA | 41.25 | 41.43 | 41.52 | | 12 day SMA | 41.1 | 41.11 | 41.04 | | 20 day SMA | 41.2 | 41.21 | 41.21 | | 35 day SMA | 41.64 | 41.71 | 41.73 | | 50 day SMA | 41.57 | 41.59 | 41.6 | | 100 day SMA | 40.61 | 40.56 | 40.51 | | 150 day SMA | 39.01 | 38.96 | 38.91 | | 200 day SMA | 38.47 | 38.48 | 38.47 |
|
|
