RexAmerican REX full analysis,charts,indicators,moving averages,SMA,DMA,EMA,ADX,MACD,RSIRex American REX WideScreen charts, DMA,SMA,EMA technical analysis, forecast prediction, by indicators ADX,MACD,RSI,CCI USA stock exchange
operates under Basic Industries sector & deals in Major Chemicals
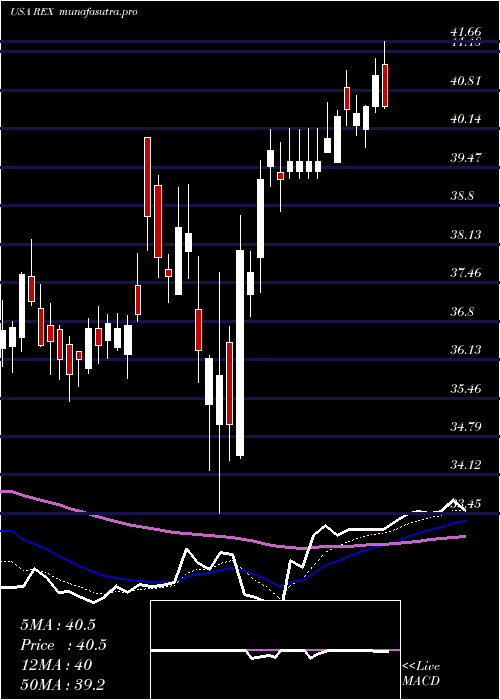
Daily price and charts and targets RexAmerican Strong Daily Stock price targets for RexAmerican REX are 32.11 and 35.79 | Daily Target 1 | 31.12 | | Daily Target 2 | 33.09 | | Daily Target 3 | 34.796666666667 | | Daily Target 4 | 36.77 | | Daily Target 5 | 38.48 |
Daily price and volume Rex American
| Date |
Closing |
Open |
Range |
Volume |
Thu 04 December 2025 |
35.07 (4.69%) |
35.22 |
32.82 - 36.50 |
1.2766 times |
Wed 03 December 2025 |
33.50 (-0.56%) |
33.67 |
33.10 - 33.78 |
0.8729 times |
Tue 02 December 2025 |
33.69 (0.96%) |
33.54 |
32.34 - 33.74 |
1.1846 times |
Mon 01 December 2025 |
33.37 (1.15%) |
32.99 |
32.89 - 33.39 |
0.7429 times |
Fri 28 November 2025 |
32.99 (-0.03%) |
32.95 |
32.46 - 33.19 |
0.309 times |
Wed 26 November 2025 |
33.00 (0.95%) |
32.46 |
32.46 - 33.56 |
1.5746 times |
Tue 25 November 2025 |
32.69 (2.77%) |
31.83 |
31.83 - 32.93 |
1.0669 times |
Mon 24 November 2025 |
31.81 (-1.64%) |
32.39 |
31.74 - 32.61 |
0.9136 times |
Fri 21 November 2025 |
32.34 (2.05%) |
31.75 |
31.71 - 32.55 |
1.3839 times |
Thu 20 November 2025 |
31.69 (-1.18%) |
32.29 |
31.56 - 32.88 |
0.6751 times |
Wed 19 November 2025 |
32.07 (0.16%) |
31.76 |
31.23 - 32.37 |
0.574 times |
Weekly price and charts RexAmerican Strong weekly Stock price targets for RexAmerican REX are 33.71 and 37.87 | Weekly Target 1 | 30.48 | | Weekly Target 2 | 32.77 | | Weekly Target 3 | 34.636666666667 | | Weekly Target 4 | 36.93 | | Weekly Target 5 | 38.8 |
Weekly price and volumes for Rex American
| Date |
Closing |
Open |
Range |
Volume |
Thu 04 December 2025 |
35.07 (6.3%) |
32.99 |
32.34 - 36.50 |
1.2968 times |
Fri 28 November 2025 |
32.99 (2.01%) |
32.39 |
31.74 - 33.56 |
1.2291 times |
Fri 21 November 2025 |
32.34 (-2.68%) |
33.19 |
31.23 - 33.48 |
1.1917 times |
Fri 14 November 2025 |
33.23 (3.71%) |
32.43 |
32.07 - 33.97 |
1.0982 times |
Fri 07 November 2025 |
32.04 (0.03%) |
31.97 |
31.00 - 32.79 |
0.8024 times |
Fri 31 October 2025 |
32.03 (0%) |
31.87 |
31.74 - 32.33 |
0.1931 times |
Fri 31 October 2025 |
32.03 (-0.22%) |
32.03 |
31.48 - 32.60 |
1.0959 times |
Fri 24 October 2025 |
32.10 (0.25%) |
32.25 |
30.46 - 32.82 |
1.1202 times |
Fri 17 October 2025 |
32.02 (1.84%) |
30.88 |
30.51 - 33.77 |
1.6187 times |
Tue 07 October 2025 |
31.44 (-0.6%) |
31.65 |
31.16 - 32.83 |
0.354 times |
Fri 03 October 2025 |
31.63 (1.61%) |
30.93 |
30.30 - 32.30 |
1.1657 times |
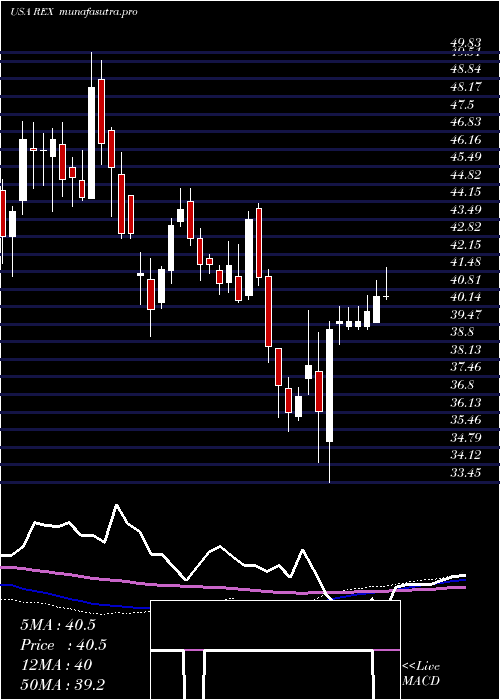
Monthly price and charts RexAmerican Strong monthly Stock price targets for RexAmerican REX are 33.71 and 37.87 | Monthly Target 1 | 30.48 | | Monthly Target 2 | 32.77 | | Monthly Target 3 | 34.636666666667 | | Monthly Target 4 | 36.93 | | Monthly Target 5 | 38.8 |
Monthly price and volumes Rex American
| Date |
Closing |
Open |
Range |
Volume |
Thu 04 December 2025 |
35.07 (6.3%) |
32.99 |
32.34 - 36.50 |
0.3429 times |
Fri 28 November 2025 |
32.99 (3%) |
31.97 |
31.00 - 33.97 |
1.1426 times |
Fri 31 October 2025 |
32.03 (4.6%) |
30.62 |
30.43 - 33.77 |
1.3271 times |
Tue 30 September 2025 |
30.62 (-51.06%) |
62.21 |
30.02 - 63.68 |
1.5154 times |
Fri 29 August 2025 |
62.57 (19.68%) |
52.21 |
49.75 - 64.95 |
0.8106 times |
Thu 31 July 2025 |
52.28 (7.33%) |
48.70 |
48.32 - 55.36 |
0.7773 times |
Mon 30 June 2025 |
48.71 (15.59%) |
42.04 |
40.98 - 50.13 |
0.9695 times |
Fri 30 May 2025 |
42.14 (6.09%) |
39.61 |
38.88 - 43.62 |
0.8349 times |
Wed 30 April 2025 |
39.72 (5.72%) |
37.26 |
33.45 - 41.66 |
1.3246 times |
Mon 31 March 2025 |
37.57 (-2.72%) |
38.57 |
35.40 - 39.99 |
0.9552 times |
Fri 28 February 2025 |
38.62 (-7.43%) |
41.31 |
38.01 - 44.10 |
0.8913 times |

DMA SMA EMA moving averages of Rex American REX
DMA (daily moving average) of Rex American REX
| DMA period | DMA value | | 5 day DMA | 33.72 | | 12 day DMA | 32.85 | | 20 day DMA | 32.8 | | 35 day DMA | 32.42 | | 50 day DMA | 32.1 | | 100 day DMA | 43.41 | | 150 day DMA | 43.88 | | 200 day DMA | 42.54 | EMA (exponential moving average) of Rex American REX
| EMA period | EMA current | EMA prev | EMA prev2 | | 5 day EMA | 33.87 | 33.27 | 33.16 | | 12 day EMA | 33.24 | 32.91 | 32.8 | | 20 day EMA | 32.94 | 32.72 | 32.64 | | 35 day EMA | 32.76 | 32.62 | 32.57 | | 50 day EMA | 32.64 | 32.54 | 32.5 |
SMA (simple moving average) of Rex American REX
| SMA period | SMA current | SMA prev | SMA prev2 | | 5 day SMA | 33.72 | 33.31 | 33.15 | | 12 day SMA | 32.85 | 32.61 | 32.59 | | 20 day SMA | 32.8 | 32.66 | 32.58 | | 35 day SMA | 32.42 | 32.37 | 32.35 | | 50 day SMA | 32.1 | 32.01 | 31.95 | | 100 day SMA | 43.41 | 43.61 | 43.81 | | 150 day SMA | 43.88 | 43.91 | 43.96 | | 200 day SMA | 42.54 | 42.57 | 42.62 |
|
|
