RpcInc RES full analysis,charts,indicators,moving averages,SMA,DMA,EMA,ADX,MACD,RSIRpc Inc RES WideScreen charts, DMA,SMA,EMA technical analysis, forecast prediction, by indicators ADX,MACD,RSI,CCI USA stock exchange
operates under Energy sector & deals in Oilfield Services Equipment
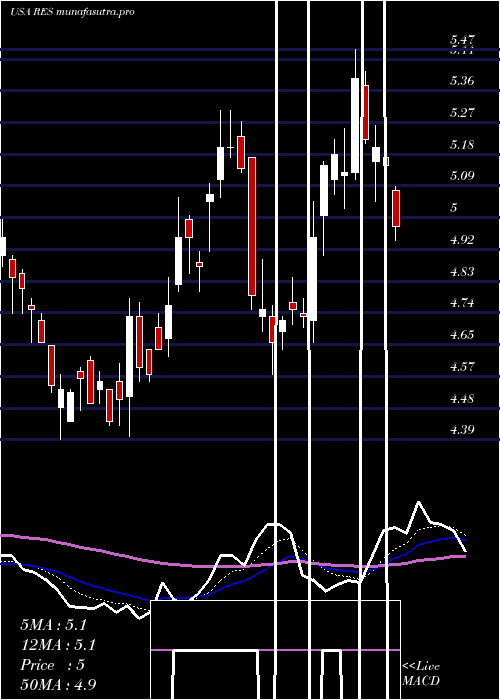
Daily price and charts and targets RpcInc Strong Daily Stock price targets for RpcInc RES are 5.73 and 5.88 | Daily Target 1 | 5.61 | | Daily Target 2 | 5.7 | | Daily Target 3 | 5.76 | | Daily Target 4 | 5.85 | | Daily Target 5 | 5.91 |
Daily price and volume Rpc Inc
| Date |
Closing |
Open |
Range |
Volume |
Thu 04 December 2025 |
5.79 (0.7%) |
5.71 |
5.67 - 5.82 |
0.7155 times |
Wed 03 December 2025 |
5.75 (6.48%) |
5.46 |
5.44 - 5.75 |
0.827 times |
Tue 02 December 2025 |
5.40 (0.37%) |
5.34 |
5.25 - 5.44 |
0.5327 times |
Mon 01 December 2025 |
5.38 (1.13%) |
5.34 |
5.32 - 5.49 |
0.844 times |
Fri 28 November 2025 |
5.32 (0.57%) |
5.28 |
5.25 - 5.36 |
0.3876 times |
Wed 26 November 2025 |
5.29 (0.57%) |
5.23 |
5.22 - 5.33 |
1.2615 times |
Tue 25 November 2025 |
5.26 (0.77%) |
5.20 |
5.15 - 5.30 |
1.4429 times |
Mon 24 November 2025 |
5.22 (-0.76%) |
5.21 |
5.14 - 5.26 |
0.9758 times |
Fri 21 November 2025 |
5.26 (3.95%) |
5.09 |
5.00 - 5.28 |
1.2738 times |
Thu 20 November 2025 |
5.06 (-2.69%) |
5.24 |
5.03 - 5.34 |
1.7392 times |
Wed 19 November 2025 |
5.20 (-2.07%) |
5.18 |
5.14 - 5.28 |
1.0256 times |
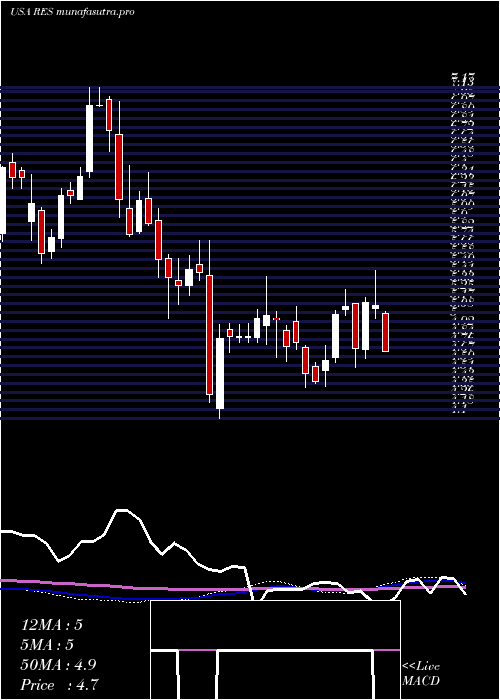
Weekly price and charts RpcInc Strong weekly Stock price targets for RpcInc RES are 5.52 and 6.09 | Weekly Target 1 | 5.05 | | Weekly Target 2 | 5.42 | | Weekly Target 3 | 5.62 | | Weekly Target 4 | 5.99 | | Weekly Target 5 | 6.19 |
Weekly price and volumes for Rpc Inc
| Date |
Closing |
Open |
Range |
Volume |
Thu 04 December 2025 |
5.79 (8.83%) |
5.34 |
5.25 - 5.82 |
0.7317 times |
Fri 28 November 2025 |
5.32 (1.14%) |
5.21 |
5.14 - 5.36 |
1.0196 times |
Fri 21 November 2025 |
5.26 (-2.59%) |
5.42 |
5.00 - 5.51 |
1.4665 times |
Fri 14 November 2025 |
5.40 (-1.64%) |
5.48 |
5.28 - 5.73 |
1.3939 times |
Fri 07 November 2025 |
5.49 (5.58%) |
5.34 |
5.26 - 5.58 |
1.1162 times |
Fri 31 October 2025 |
5.20 (0%) |
5.59 |
5.17 - 5.59 |
0.3224 times |
Fri 31 October 2025 |
5.20 (9.01%) |
4.76 |
4.74 - 5.60 |
1.5173 times |
Fri 24 October 2025 |
4.77 (9.91%) |
4.36 |
4.36 - 4.87 |
1.0644 times |
Fri 17 October 2025 |
4.34 (-8.63%) |
4.30 |
4.18 - 4.45 |
1.0988 times |
Tue 07 October 2025 |
4.75 (-0.84%) |
4.82 |
4.69 - 4.88 |
0.2692 times |
Fri 03 October 2025 |
4.79 (-1.64%) |
4.81 |
4.64 - 4.85 |
0.9915 times |
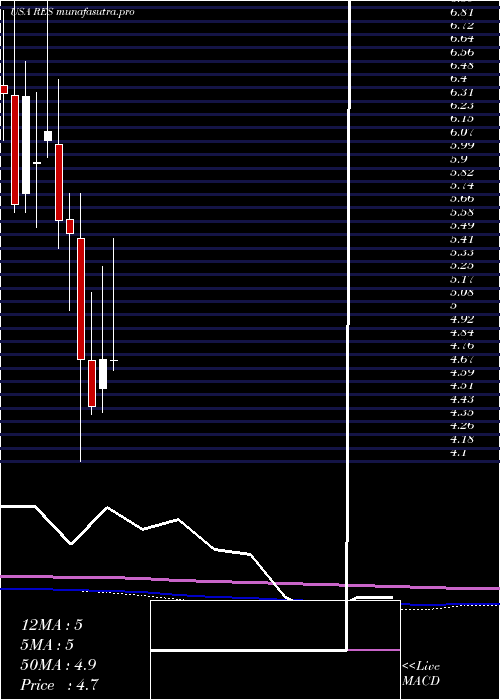
Monthly price and charts RpcInc Strong monthly Stock price targets for RpcInc RES are 5.52 and 6.09 | Monthly Target 1 | 5.05 | | Monthly Target 2 | 5.42 | | Monthly Target 3 | 5.62 | | Monthly Target 4 | 5.99 | | Monthly Target 5 | 6.19 |
Monthly price and volumes Rpc Inc
| Date |
Closing |
Open |
Range |
Volume |
Thu 04 December 2025 |
5.79 (8.83%) |
5.34 |
5.25 - 5.82 |
0.1531 times |
Fri 28 November 2025 |
5.32 (2.31%) |
5.34 |
5.00 - 5.73 |
1.0455 times |
Fri 31 October 2025 |
5.20 (9.24%) |
4.70 |
4.18 - 5.60 |
1.0153 times |
Tue 30 September 2025 |
4.76 (-0.21%) |
4.75 |
4.41 - 4.96 |
0.9692 times |
Fri 29 August 2025 |
4.77 (2.58%) |
4.60 |
4.32 - 4.81 |
1.116 times |
Thu 31 July 2025 |
4.65 (-1.69%) |
4.72 |
4.39 - 5.47 |
1.4774 times |
Mon 30 June 2025 |
4.73 (6.53%) |
4.55 |
4.40 - 5.30 |
1.0457 times |
Fri 30 May 2025 |
4.44 (-6.13%) |
4.72 |
4.39 - 5.14 |
0.7195 times |
Wed 30 April 2025 |
4.73 (-14%) |
5.47 |
4.10 - 5.75 |
1.2335 times |
Mon 31 March 2025 |
5.50 (-1.43%) |
5.59 |
5.03 - 5.75 |
1.2249 times |
Fri 28 February 2025 |
5.58 (-8.97%) |
6.05 |
5.41 - 6.45 |
0.8145 times |
DMA SMA EMA moving averages of Rpc Inc RES
DMA (daily moving average) of Rpc Inc RES
| DMA period | DMA value | | 5 day DMA | 5.53 | | 12 day DMA | 5.35 | | 20 day DMA | 5.39 | | 35 day DMA | 5.17 | | 50 day DMA | 5.02 | | 100 day DMA | 4.84 | | 150 day DMA | 4.84 | | 200 day DMA | 4.95 | EMA (exponential moving average) of Rpc Inc RES
| EMA period | EMA current | EMA prev | EMA prev2 | | 5 day EMA | 5.58 | 5.48 | 5.34 | | 12 day EMA | 5.44 | 5.38 | 5.31 | | 20 day EMA | 5.36 | 5.31 | 5.26 | | 35 day EMA | 5.19 | 5.15 | 5.11 | | 50 day EMA | 5.04 | 5.01 | 4.98 |
SMA (simple moving average) of Rpc Inc RES
| SMA period | SMA current | SMA prev | SMA prev2 | | 5 day SMA | 5.53 | 5.43 | 5.33 | | 12 day SMA | 5.35 | 5.31 | 5.28 | | 20 day SMA | 5.39 | 5.37 | 5.36 | | 35 day SMA | 5.17 | 5.13 | 5.09 | | 50 day SMA | 5.02 | 4.99 | 4.97 | | 100 day SMA | 4.84 | 4.83 | 4.83 | | 150 day SMA | 4.84 | 4.83 | 4.83 | | 200 day SMA | 4.95 | 4.95 | 4.96 |
|
|
