RedhillBiopharma RDHL full analysis,charts,indicators,moving averages,SMA,DMA,EMA,ADX,MACD,RSIRedhill Biopharma RDHL WideScreen charts, DMA,SMA,EMA technical analysis, forecast prediction, by indicators ADX,MACD,RSI,CCI USA stock exchange
operates under Health Care sector & deals in Major Pharmaceuticals
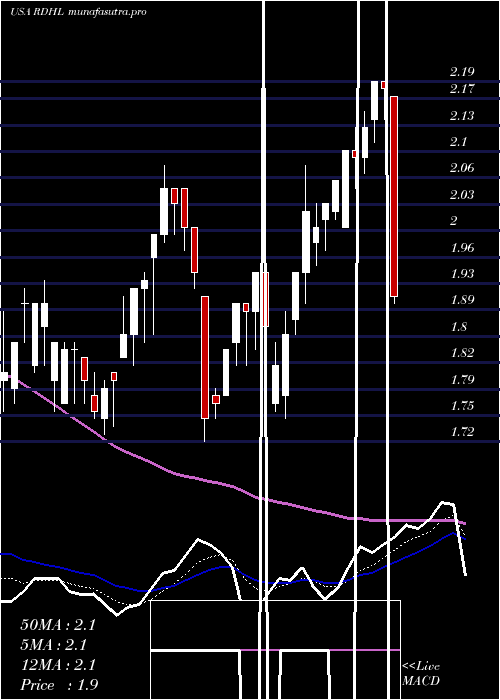
Daily price and charts and targets RedhillBiopharma Strong Daily Stock price targets for RedhillBiopharma RDHL are 1.18 and 1.22 | Daily Target 1 | 1.15 | | Daily Target 2 | 1.17 | | Daily Target 3 | 1.1866666666667 | | Daily Target 4 | 1.21 | | Daily Target 5 | 1.23 |
Daily price and volume Redhill Biopharma
| Date |
Closing |
Open |
Range |
Volume |
Thu 04 December 2025 |
1.20 (2.56%) |
1.19 |
1.16 - 1.20 |
0.4611 times |
Wed 03 December 2025 |
1.17 (-1.68%) |
1.16 |
1.14 - 1.20 |
0.28 times |
Tue 02 December 2025 |
1.19 (-4.03%) |
1.21 |
1.17 - 1.22 |
0.9844 times |
Mon 01 December 2025 |
1.24 (3.33%) |
1.20 |
1.20 - 1.25 |
1.3632 times |
Fri 28 November 2025 |
1.20 (10.09%) |
1.08 |
1.07 - 1.25 |
1.3555 times |
Wed 26 November 2025 |
1.09 (-1.8%) |
1.10 |
1.08 - 1.11 |
0.7677 times |
Tue 25 November 2025 |
1.11 (7.77%) |
1.03 |
1.03 - 1.11 |
0.921 times |
Mon 24 November 2025 |
1.03 (-3.74%) |
1.06 |
1.01 - 1.07 |
1.4684 times |
Fri 21 November 2025 |
1.07 (2.88%) |
1.03 |
1.03 - 1.07 |
0.8699 times |
Thu 20 November 2025 |
1.04 (0%) |
1.05 |
1.01 - 1.07 |
1.5288 times |
Wed 19 November 2025 |
1.04 (-1.89%) |
1.04 |
1.01 - 1.06 |
0.3966 times |
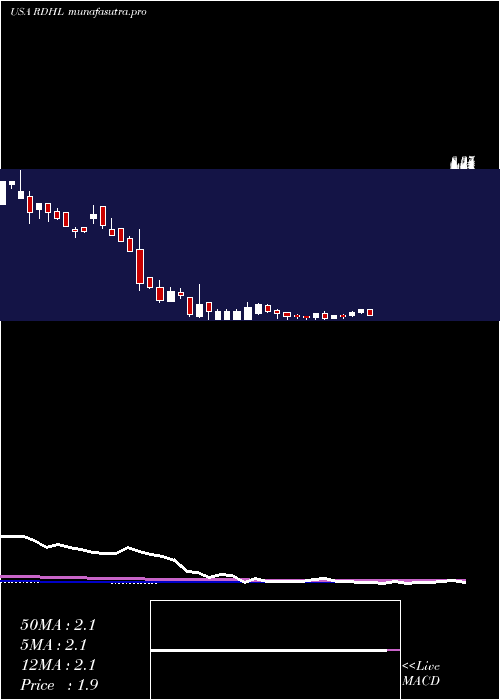
Weekly price and charts RedhillBiopharma Strong weekly Stock price targets for RedhillBiopharma RDHL are 1.15 and 1.26 | Weekly Target 1 | 1.09 | | Weekly Target 2 | 1.14 | | Weekly Target 3 | 1.1966666666667 | | Weekly Target 4 | 1.25 | | Weekly Target 5 | 1.31 |
Weekly price and volumes for Redhill Biopharma
| Date |
Closing |
Open |
Range |
Volume |
Thu 04 December 2025 |
1.20 (0%) |
1.20 |
1.14 - 1.25 |
0.0521 times |
Fri 28 November 2025 |
1.20 (12.15%) |
1.06 |
1.01 - 1.25 |
0.0762 times |
Fri 21 November 2025 |
1.07 (0%) |
1.08 |
1.01 - 1.08 |
0.0689 times |
Fri 14 November 2025 |
1.07 (-6.14%) |
1.07 |
1.02 - 1.11 |
0.1313 times |
Fri 07 November 2025 |
1.14 (-12.31%) |
1.24 |
1.04 - 1.68 |
5.0813 times |
Fri 31 October 2025 |
1.30 (0%) |
1.37 |
1.30 - 1.38 |
0.018 times |
Fri 31 October 2025 |
1.30 (-21.21%) |
1.67 |
1.30 - 1.67 |
0.091 times |
Fri 24 October 2025 |
1.65 (10%) |
1.53 |
1.41 - 3.04 |
4.291 times |
Fri 17 October 2025 |
1.50 (-11.76%) |
1.70 |
1.50 - 1.74 |
0.0599 times |
Fri 10 October 2025 |
1.70 (-10.99%) |
1.96 |
1.69 - 2.38 |
0.1304 times |
Fri 03 October 2025 |
1.91 (3.8%) |
2.58 |
1.88 - 2.79 |
10.7947 times |
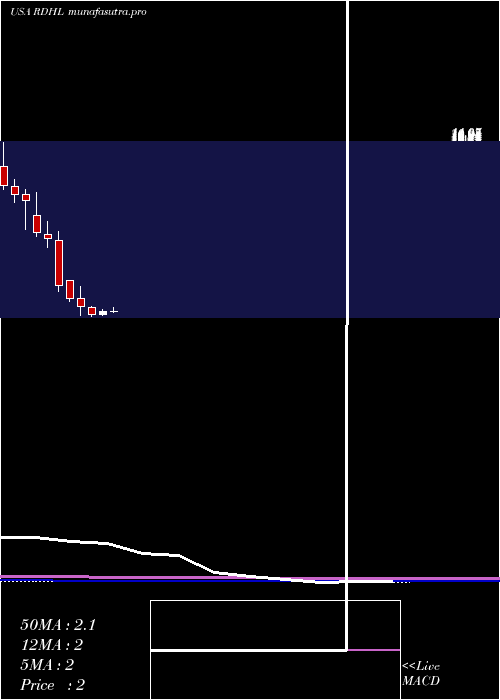
Monthly price and charts RedhillBiopharma Strong monthly Stock price targets for RedhillBiopharma RDHL are 1.15 and 1.26 | Monthly Target 1 | 1.09 | | Monthly Target 2 | 1.14 | | Monthly Target 3 | 1.1966666666667 | | Monthly Target 4 | 1.25 | | Monthly Target 5 | 1.31 |
Monthly price and volumes Redhill Biopharma
| Date |
Closing |
Open |
Range |
Volume |
Thu 04 December 2025 |
1.20 (0%) |
1.20 |
1.14 - 1.25 |
0.0176 times |
Fri 28 November 2025 |
1.20 (-7.69%) |
1.24 |
1.01 - 1.68 |
1.8082 times |
Fri 31 October 2025 |
1.30 (-40.09%) |
2.23 |
1.30 - 3.04 |
1.6207 times |
Tue 30 September 2025 |
2.17 (60.74%) |
1.34 |
1.22 - 2.79 |
3.6332 times |
Fri 29 August 2025 |
1.35 (3.05%) |
1.31 |
1.06 - 1.48 |
0.1359 times |
Thu 31 July 2025 |
1.31 (-32.47%) |
1.94 |
1.30 - 3.31 |
1.7812 times |
Mon 30 June 2025 |
1.94 (8.38%) |
1.81 |
1.72 - 2.08 |
0.0217 times |
Fri 30 May 2025 |
1.79 (-19%) |
2.15 |
1.71 - 2.21 |
0.2786 times |
Wed 30 April 2025 |
2.21 (-16.92%) |
2.66 |
1.72 - 3.30 |
0.5515 times |
Mon 31 March 2025 |
2.66 (-20.12%) |
3.60 |
2.47 - 3.60 |
0.1515 times |
Fri 28 February 2025 |
3.33 (-43.65%) |
5.76 |
3.01 - 6.26 |
0.1761 times |
DMA SMA EMA moving averages of Redhill Biopharma RDHL
DMA (daily moving average) of Redhill Biopharma RDHL
| DMA period | DMA value | | 5 day DMA | 1.2 | | 12 day DMA | 1.12 | | 20 day DMA | 1.1 | | 35 day DMA | 1.27 | | 50 day DMA | 1.46 | | 100 day DMA | 1.49 | | 150 day DMA | 1.64 | | 200 day DMA | 1.94 | EMA (exponential moving average) of Redhill Biopharma RDHL
| EMA period | EMA current | EMA prev | EMA prev2 | | 5 day EMA | 1.18 | 1.17 | 1.17 | | 12 day EMA | 1.15 | 1.14 | 1.14 | | 20 day EMA | 1.17 | 1.17 | 1.17 | | 35 day EMA | 1.29 | 1.3 | 1.31 | | 50 day EMA | 1.46 | 1.47 | 1.48 |
SMA (simple moving average) of Redhill Biopharma RDHL
| SMA period | SMA current | SMA prev | SMA prev2 | | 5 day SMA | 1.2 | 1.18 | 1.17 | | 12 day SMA | 1.12 | 1.11 | 1.1 | | 20 day SMA | 1.1 | 1.1 | 1.09 | | 35 day SMA | 1.27 | 1.28 | 1.29 | | 50 day SMA | 1.46 | 1.47 | 1.48 | | 100 day SMA | 1.49 | 1.5 | 1.51 | | 150 day SMA | 1.64 | 1.65 | 1.65 | | 200 day SMA | 1.94 | 1.96 | 1.98 |
|
|
