ReconTechnology RCON full analysis,charts,indicators,moving averages,SMA,DMA,EMA,ADX,MACD,RSIRecon Technology RCON WideScreen charts, DMA,SMA,EMA technical analysis, forecast prediction, by indicators ADX,MACD,RSI,CCI USA stock exchange
operates under Energy sector & deals in Oilfield Services Equipment
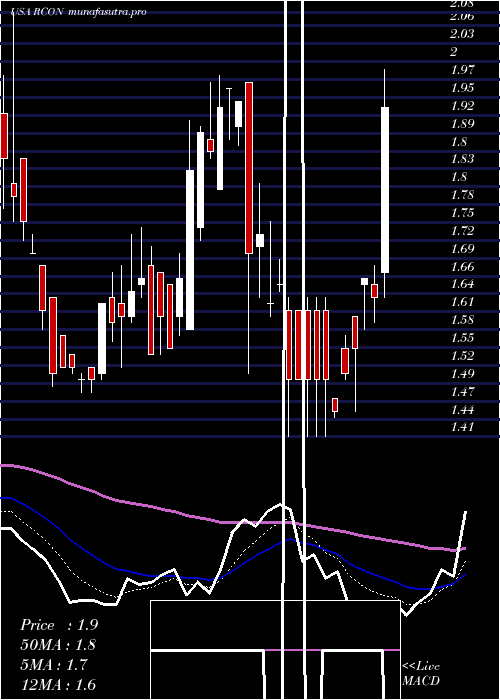
Daily price and charts and targets ReconTechnology Strong Daily Stock price targets for ReconTechnology RCON are 1.3 and 1.36 | Daily Target 1 | 1.25 | | Daily Target 2 | 1.29 | | Daily Target 3 | 1.31 | | Daily Target 4 | 1.35 | | Daily Target 5 | 1.37 |
Daily price and volume Recon Technology
| Date |
Closing |
Open |
Range |
Volume |
Thu 04 December 2025 |
1.33 (4.72%) |
1.30 |
1.27 - 1.33 |
0.2033 times |
Wed 03 December 2025 |
1.27 (-3.79%) |
1.33 |
1.26 - 1.40 |
0.8537 times |
Tue 02 December 2025 |
1.32 (-6.38%) |
1.46 |
1.32 - 1.46 |
0.1491 times |
Mon 01 December 2025 |
1.41 (6.82%) |
1.32 |
1.28 - 1.46 |
0.4607 times |
Fri 28 November 2025 |
1.32 (5.6%) |
1.25 |
1.25 - 1.44 |
0.7317 times |
Wed 26 November 2025 |
1.25 (3.31%) |
1.17 |
1.17 - 1.44 |
2.9946 times |
Tue 25 November 2025 |
1.21 (5.22%) |
1.16 |
1.16 - 1.21 |
0.0949 times |
Mon 24 November 2025 |
1.15 (-1.71%) |
1.15 |
1.15 - 1.15 |
0.0813 times |
Fri 21 November 2025 |
1.17 (0.86%) |
1.15 |
1.13 - 1.21 |
1.7209 times |
Thu 20 November 2025 |
1.16 (-3.33%) |
1.25 |
1.15 - 1.25 |
2.71 times |
Wed 19 November 2025 |
1.20 (-5.51%) |
1.29 |
1.20 - 1.29 |
1.7073 times |
Weekly price and charts ReconTechnology Strong weekly Stock price targets for ReconTechnology RCON are 1.3 and 1.5 | Weekly Target 1 | 1.15 | | Weekly Target 2 | 1.24 | | Weekly Target 3 | 1.35 | | Weekly Target 4 | 1.44 | | Weekly Target 5 | 1.55 |
Weekly price and volumes for Recon Technology
| Date |
Closing |
Open |
Range |
Volume |
Thu 04 December 2025 |
1.33 (0.76%) |
1.32 |
1.26 - 1.46 |
0.131 times |
Fri 28 November 2025 |
1.32 (12.82%) |
1.15 |
1.15 - 1.44 |
0.3067 times |
Fri 21 November 2025 |
1.17 (-11.36%) |
1.25 |
1.13 - 1.36 |
0.7817 times |
Fri 14 November 2025 |
1.32 (-4.35%) |
1.39 |
1.27 - 1.43 |
0.5974 times |
Fri 07 November 2025 |
1.38 (-21.14%) |
1.67 |
1.25 - 1.67 |
2.1768 times |
Fri 31 October 2025 |
1.75 (0%) |
1.76 |
1.71 - 1.85 |
0.1299 times |
Fri 31 October 2025 |
1.75 (-6.42%) |
1.78 |
1.70 - 1.88 |
1.0437 times |
Fri 24 October 2025 |
1.87 (5.06%) |
1.81 |
1.71 - 1.95 |
2.1384 times |
Fri 17 October 2025 |
1.78 (-11%) |
2.02 |
1.76 - 2.07 |
1.3557 times |
Fri 10 October 2025 |
2.00 (1.01%) |
2.02 |
1.88 - 2.06 |
1.3387 times |
Fri 03 October 2025 |
1.98 (-1.98%) |
2.01 |
1.91 - 2.12 |
1.1451 times |
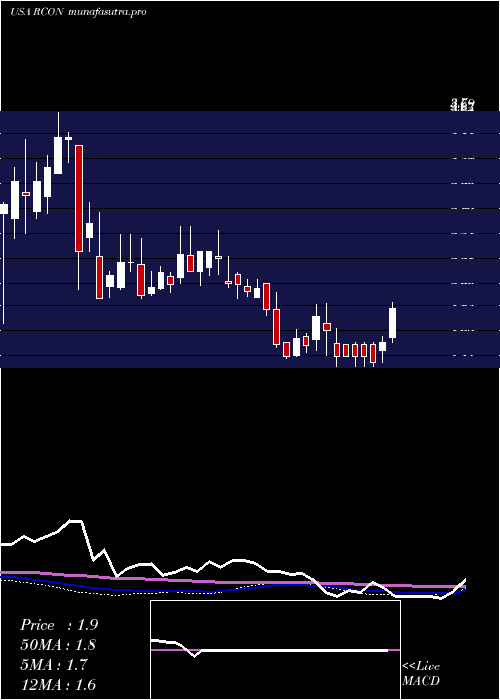
Monthly price and charts ReconTechnology Strong monthly Stock price targets for ReconTechnology RCON are 1.3 and 1.5 | Monthly Target 1 | 1.15 | | Monthly Target 2 | 1.24 | | Monthly Target 3 | 1.35 | | Monthly Target 4 | 1.44 | | Monthly Target 5 | 1.55 |
Monthly price and volumes Recon Technology
| Date |
Closing |
Open |
Range |
Volume |
Thu 04 December 2025 |
1.33 (0.76%) |
1.32 |
1.26 - 1.46 |
0.0022 times |
Fri 28 November 2025 |
1.32 (-24.57%) |
1.67 |
1.13 - 1.67 |
0.0635 times |
Fri 31 October 2025 |
1.75 (-11.62%) |
1.98 |
1.70 - 2.07 |
0.1128 times |
Tue 30 September 2025 |
1.98 (-6.16%) |
2.14 |
1.86 - 2.24 |
0.1228 times |
Fri 29 August 2025 |
2.11 (-53.11%) |
4.31 |
2.04 - 4.35 |
0.5578 times |
Thu 31 July 2025 |
4.50 (78.57%) |
2.44 |
1.85 - 7.16 |
8.7931 times |
Mon 30 June 2025 |
2.52 (21.15%) |
2.12 |
2.02 - 2.80 |
0.2011 times |
Fri 30 May 2025 |
2.08 (7.77%) |
1.93 |
1.40 - 2.59 |
0.0694 times |
Wed 30 April 2025 |
1.93 (24.52%) |
1.60 |
1.41 - 2.00 |
0.0495 times |
Mon 31 March 2025 |
1.55 (-19.27%) |
1.92 |
1.48 - 2.08 |
0.0278 times |
Fri 28 February 2025 |
1.92 (-11.11%) |
2.24 |
1.87 - 2.26 |
0.0185 times |

DMA SMA EMA moving averages of Recon Technology RCON
DMA (daily moving average) of Recon Technology RCON
| DMA period | DMA value | | 5 day DMA | 1.33 | | 12 day DMA | 1.26 | | 20 day DMA | 1.3 | | 35 day DMA | 1.48 | | 50 day DMA | 1.64 | | 100 day DMA | 2.03 | | 150 day DMA | 2.1 | | 200 day DMA | 2.01 | EMA (exponential moving average) of Recon Technology RCON
| EMA period | EMA current | EMA prev | EMA prev2 | | 5 day EMA | 1.31 | 1.3 | 1.31 | | 12 day EMA | 1.3 | 1.3 | 1.31 | | 20 day EMA | 1.35 | 1.35 | 1.36 | | 35 day EMA | 1.48 | 1.49 | 1.5 | | 50 day EMA | 1.64 | 1.65 | 1.67 |
SMA (simple moving average) of Recon Technology RCON
| SMA period | SMA current | SMA prev | SMA prev2 | | 5 day SMA | 1.33 | 1.31 | 1.3 | | 12 day SMA | 1.26 | 1.25 | 1.26 | | 20 day SMA | 1.3 | 1.3 | 1.31 | | 35 day SMA | 1.48 | 1.5 | 1.52 | | 50 day SMA | 1.64 | 1.65 | 1.67 | | 100 day SMA | 2.03 | 2.04 | 2.05 | | 150 day SMA | 2.1 | 2.1 | 2.11 | | 200 day SMA | 2.01 | 2.01 | 2.01 |
|
|
