RhinebeckBancorp RBKB full analysis,charts,indicators,moving averages,SMA,DMA,EMA,ADX,MACD,RSIRhinebeck Bancorp RBKB WideScreen charts, DMA,SMA,EMA technical analysis, forecast prediction, by indicators ADX,MACD,RSI,CCI USA stock exchange
operates under Finance sector & deals in Banks
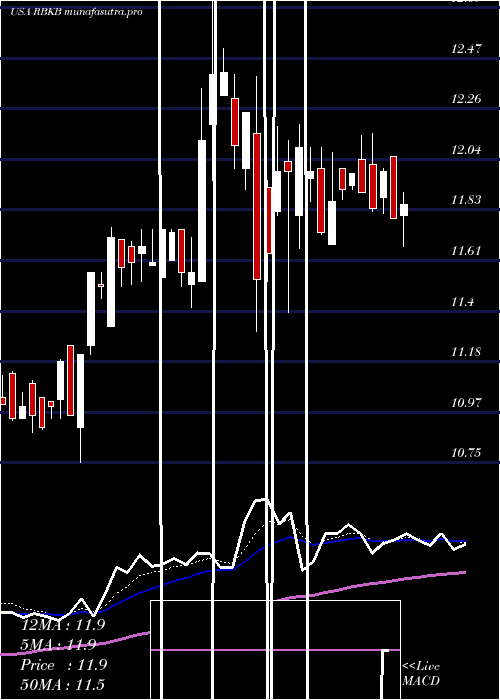
Daily price and charts and targets RhinebeckBancorp Strong Daily Stock price targets for RhinebeckBancorp RBKB are 11.41 and 11.88 | Daily Target 1 | 11.01 | | Daily Target 2 | 11.33 | | Daily Target 3 | 11.483333333333 | | Daily Target 4 | 11.8 | | Daily Target 5 | 11.95 |
Daily price and volume Rhinebeck Bancorp
| Date |
Closing |
Open |
Range |
Volume |
Thu 04 December 2025 |
11.64 (3.47%) |
11.30 |
11.17 - 11.64 |
1.4455 times |
Wed 03 December 2025 |
11.25 (3.59%) |
11.06 |
11.05 - 11.28 |
1.6294 times |
Tue 02 December 2025 |
10.86 (-1.54%) |
11.05 |
10.86 - 11.05 |
0.4862 times |
Mon 01 December 2025 |
11.03 (1.29%) |
10.98 |
10.98 - 11.12 |
0.3417 times |
Fri 28 November 2025 |
10.89 (-1.36%) |
10.89 |
10.89 - 10.89 |
0.2365 times |
Wed 26 November 2025 |
11.04 (2.03%) |
10.50 |
10.32 - 11.04 |
1.9317 times |
Tue 25 November 2025 |
10.82 (4.14%) |
10.61 |
10.41 - 10.82 |
0.5519 times |
Mon 24 November 2025 |
10.39 (-2.17%) |
10.23 |
10.21 - 10.40 |
0.6045 times |
Fri 21 November 2025 |
10.62 (6.63%) |
9.96 |
9.96 - 10.62 |
1.6557 times |
Thu 20 November 2025 |
9.96 (2.05%) |
9.88 |
9.88 - 9.99 |
1.117 times |
Wed 19 November 2025 |
9.76 (-0.31%) |
9.65 |
9.51 - 9.87 |
1.3535 times |
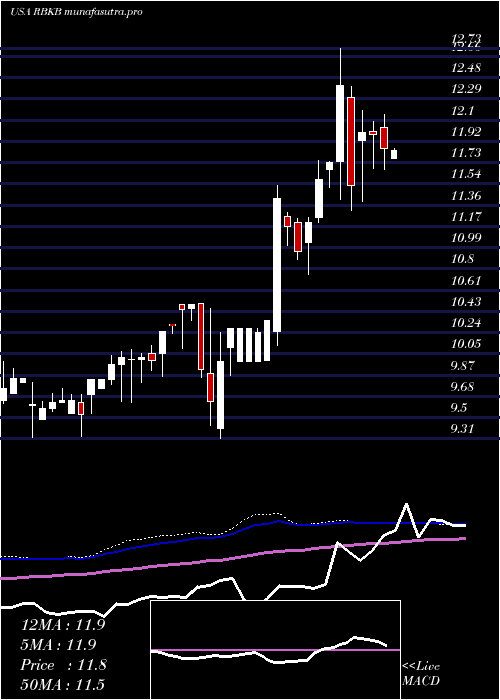
Weekly price and charts RhinebeckBancorp Strong weekly Stock price targets for RhinebeckBancorp RBKB are 11.25 and 12.03 | Weekly Target 1 | 10.6 | | Weekly Target 2 | 11.12 | | Weekly Target 3 | 11.38 | | Weekly Target 4 | 11.9 | | Weekly Target 5 | 12.16 |
Weekly price and volumes for Rhinebeck Bancorp
| Date |
Closing |
Open |
Range |
Volume |
Thu 04 December 2025 |
11.64 (6.89%) |
10.98 |
10.86 - 11.64 |
0.8101 times |
Fri 28 November 2025 |
10.89 (2.54%) |
10.23 |
10.21 - 11.04 |
0.6901 times |
Fri 21 November 2025 |
10.62 (8.04%) |
9.90 |
9.51 - 10.62 |
1.1211 times |
Fri 14 November 2025 |
9.83 (1.34%) |
9.81 |
9.51 - 9.93 |
0.7283 times |
Fri 07 November 2025 |
9.70 (-2.9%) |
9.89 |
9.41 - 10.02 |
1.323 times |
Fri 31 October 2025 |
9.99 (0%) |
9.99 |
9.81 - 9.99 |
0.1555 times |
Fri 31 October 2025 |
9.99 (-0.89%) |
10.10 |
9.60 - 10.42 |
1.6667 times |
Fri 24 October 2025 |
10.08 (-2.23%) |
10.57 |
10.03 - 10.73 |
0.7119 times |
Fri 17 October 2025 |
10.31 (-9.4%) |
11.48 |
10.30 - 11.50 |
1.7976 times |
Fri 10 October 2025 |
11.38 (-2.98%) |
11.75 |
11.37 - 11.99 |
0.9956 times |
Fri 03 October 2025 |
11.73 (-0.93%) |
11.53 |
11.05 - 11.73 |
0.5318 times |
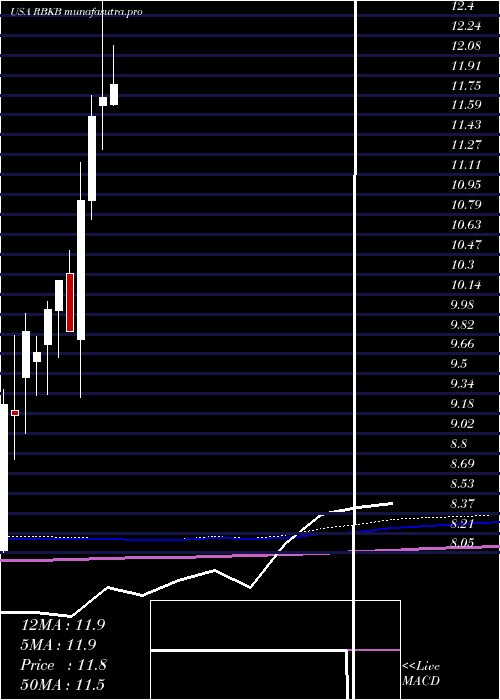
Monthly price and charts RhinebeckBancorp Strong monthly Stock price targets for RhinebeckBancorp RBKB are 11.25 and 12.03 | Monthly Target 1 | 10.6 | | Monthly Target 2 | 11.12 | | Monthly Target 3 | 11.38 | | Monthly Target 4 | 11.9 | | Monthly Target 5 | 12.16 |
Monthly price and volumes Rhinebeck Bancorp
| Date |
Closing |
Open |
Range |
Volume |
Thu 04 December 2025 |
11.64 (6.89%) |
10.98 |
10.86 - 11.64 |
0.1316 times |
Fri 28 November 2025 |
10.89 (9.01%) |
9.89 |
9.41 - 11.04 |
0.6273 times |
Fri 31 October 2025 |
9.99 (-12.06%) |
11.20 |
9.60 - 11.99 |
0.9117 times |
Tue 30 September 2025 |
11.36 (-15.03%) |
13.36 |
11.01 - 13.71 |
0.5888 times |
Fri 29 August 2025 |
13.37 (5.36%) |
12.65 |
12.15 - 13.99 |
0.6924 times |
Thu 31 July 2025 |
12.69 (8.18%) |
11.68 |
11.65 - 13.06 |
1.1552 times |
Mon 30 June 2025 |
11.73 (1.3%) |
11.67 |
11.31 - 12.73 |
4.1183 times |
Fri 30 May 2025 |
11.58 (6.24%) |
10.90 |
10.75 - 11.75 |
0.8909 times |
Wed 30 April 2025 |
10.90 (10.77%) |
9.78 |
9.31 - 11.21 |
0.6082 times |
Mon 31 March 2025 |
9.84 (-4%) |
10.31 |
9.84 - 10.50 |
0.2757 times |
Fri 28 February 2025 |
10.25 (2.3%) |
10.01 |
9.63 - 10.25 |
0.6118 times |
DMA SMA EMA moving averages of Rhinebeck Bancorp RBKB
DMA (daily moving average) of Rhinebeck Bancorp RBKB
| DMA period | DMA value | | 5 day DMA | 11.13 | | 12 day DMA | 10.67 | | 20 day DMA | 10.3 | | 35 day DMA | 10.22 | | 50 day DMA | 10.6 | | 100 day DMA | 11.7 | | 150 day DMA | 11.67 | | 200 day DMA | 11.3 | EMA (exponential moving average) of Rhinebeck Bancorp RBKB
| EMA period | EMA current | EMA prev | EMA prev2 | | 5 day EMA | 11.19 | 10.97 | 10.83 | | 12 day EMA | 10.81 | 10.66 | 10.55 | | 20 day EMA | 10.6 | 10.49 | 10.41 | | 35 day EMA | 10.62 | 10.56 | 10.52 | | 50 day EMA | 10.75 | 10.71 | 10.69 |
SMA (simple moving average) of Rhinebeck Bancorp RBKB
| SMA period | SMA current | SMA prev | SMA prev2 | | 5 day SMA | 11.13 | 11.01 | 10.93 | | 12 day SMA | 10.67 | 10.52 | 10.4 | | 20 day SMA | 10.3 | 10.21 | 10.13 | | 35 day SMA | 10.22 | 10.2 | 10.19 | | 50 day SMA | 10.6 | 10.6 | 10.6 | | 100 day SMA | 11.7 | 11.71 | 11.71 | | 150 day SMA | 11.67 | 11.66 | 11.66 | | 200 day SMA | 11.3 | 11.29 | 11.28 |
|
|
