RbbBancorp RBB full analysis,charts,indicators,moving averages,SMA,DMA,EMA,ADX,MACD,RSIRbb Bancorp RBB WideScreen charts, DMA,SMA,EMA technical analysis, forecast prediction, by indicators ADX,MACD,RSI,CCI USA stock exchange
operates under Finance sector & deals in Major Banks
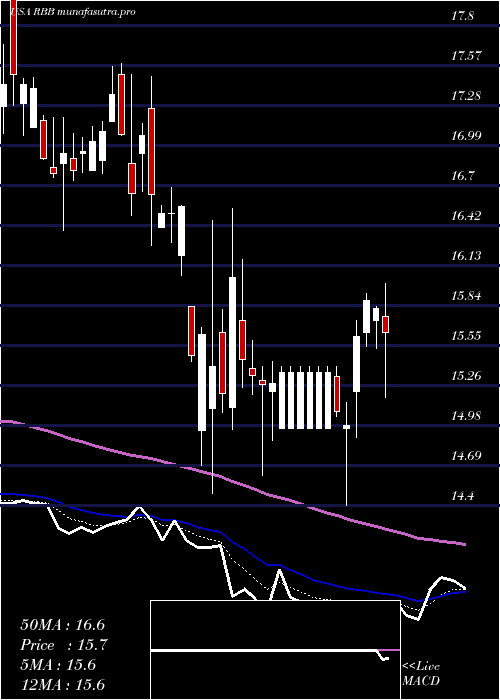
Daily price and charts and targets RbbBancorp Strong Daily Stock price targets for RbbBancorp RBB are 17.3 and 18.42 | Daily Target 1 | 16.44 | | Daily Target 2 | 17.03 | | Daily Target 3 | 17.563333333333 | | Daily Target 4 | 18.15 | | Daily Target 5 | 18.68 |
Daily price and volume Rbb Bancorp
| Date |
Closing |
Open |
Range |
Volume |
Mon 20 October 2025 |
17.61 (3.41%) |
17.30 |
16.98 - 18.10 |
1.1719 times |
Fri 17 October 2025 |
17.03 (1.19%) |
16.94 |
16.74 - 17.42 |
2.0173 times |
Thu 16 October 2025 |
16.83 (-5.77%) |
17.77 |
16.74 - 17.93 |
1.0686 times |
Wed 15 October 2025 |
17.86 (-1%) |
18.16 |
17.71 - 18.84 |
0.5664 times |
Tue 14 October 2025 |
18.04 (3.74%) |
17.20 |
17.20 - 18.11 |
0.8538 times |
Mon 13 October 2025 |
17.39 (0.69%) |
17.46 |
17.10 - 17.46 |
0.9849 times |
Fri 10 October 2025 |
17.27 (-2.92%) |
17.85 |
17.21 - 18.25 |
1.1523 times |
Thu 09 October 2025 |
17.79 (-1.82%) |
18.03 |
17.71 - 18.16 |
0.9487 times |
Wed 08 October 2025 |
18.12 (-0.49%) |
18.32 |
18.03 - 18.44 |
0.5078 times |
Tue 07 October 2025 |
18.21 (-0.98%) |
18.16 |
18.12 - 18.76 |
0.7282 times |
Mon 06 October 2025 |
18.39 (-0.54%) |
18.54 |
18.09 - 18.85 |
1.0212 times |
Weekly price and charts RbbBancorp Strong weekly Stock price targets for RbbBancorp RBB are 17.3 and 18.42 | Weekly Target 1 | 16.44 | | Weekly Target 2 | 17.03 | | Weekly Target 3 | 17.563333333333 | | Weekly Target 4 | 18.15 | | Weekly Target 5 | 18.68 |
Weekly price and volumes for Rbb Bancorp
| Date |
Closing |
Open |
Range |
Volume |
Mon 20 October 2025 |
17.61 (3.41%) |
17.30 |
16.98 - 18.10 |
0.2602 times |
Fri 17 October 2025 |
17.03 (-1.39%) |
17.46 |
16.74 - 18.84 |
1.2193 times |
Fri 10 October 2025 |
17.27 (-6.6%) |
18.54 |
17.21 - 18.85 |
0.9677 times |
Fri 03 October 2025 |
18.49 (-2.99%) |
19.09 |
17.91 - 19.24 |
0.8814 times |
Fri 26 September 2025 |
19.06 (-2.01%) |
18.89 |
18.89 - 19.79 |
1.0155 times |
Fri 19 September 2025 |
19.45 (0.93%) |
19.45 |
18.91 - 19.97 |
1.9095 times |
Fri 12 September 2025 |
19.27 (-3.21%) |
19.99 |
18.80 - 20.00 |
1.0793 times |
Fri 05 September 2025 |
19.91 (-1.58%) |
20.10 |
18.45 - 20.38 |
1.0966 times |
Fri 29 August 2025 |
20.23 (0%) |
20.54 |
20.04 - 20.55 |
0.2491 times |
Fri 29 August 2025 |
20.23 (-1.22%) |
20.35 |
20.04 - 20.65 |
1.3215 times |
Fri 22 August 2025 |
20.48 (5.84%) |
19.38 |
19.30 - 20.60 |
1.4547 times |
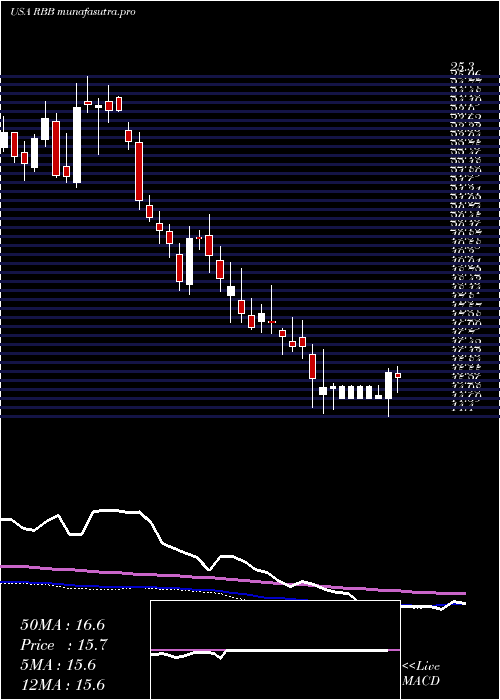
Monthly price and charts RbbBancorp Strong monthly Stock price targets for RbbBancorp RBB are 16.12 and 18.23 | Monthly Target 1 | 15.62 | | Monthly Target 2 | 16.62 | | Monthly Target 3 | 17.733333333333 | | Monthly Target 4 | 18.73 | | Monthly Target 5 | 19.84 |
Monthly price and volumes Rbb Bancorp
| Date |
Closing |
Open |
Range |
Volume |
Mon 20 October 2025 |
17.61 (-6.13%) |
18.55 |
16.74 - 18.85 |
0.4918 times |
Tue 30 September 2025 |
18.76 (-7.27%) |
20.10 |
18.16 - 20.38 |
0.8923 times |
Fri 29 August 2025 |
20.23 (11.71%) |
17.92 |
17.67 - 20.65 |
1.2119 times |
Thu 31 July 2025 |
18.11 (5.23%) |
17.20 |
17.07 - 19.73 |
2.4764 times |
Mon 30 June 2025 |
17.21 (1.35%) |
16.90 |
15.95 - 17.81 |
1.035 times |
Fri 30 May 2025 |
16.98 (8.99%) |
15.48 |
14.66 - 17.30 |
0.7821 times |
Wed 30 April 2025 |
15.58 (-5.58%) |
16.50 |
14.40 - 16.69 |
0.6847 times |
Mon 31 March 2025 |
16.50 (-6.83%) |
17.45 |
16.27 - 18.60 |
0.6193 times |
Fri 28 February 2025 |
17.71 (-5.85%) |
18.29 |
17.09 - 19.33 |
0.6656 times |
Fri 31 January 2025 |
18.81 (-8.2%) |
20.72 |
18.32 - 20.95 |
1.1409 times |
Tue 31 December 2024 |
20.49 (-15.37%) |
23.56 |
20.48 - 23.83 |
0.6187 times |

DMA SMA EMA moving averages of Rbb Bancorp RBB
DMA (daily moving average) of Rbb Bancorp RBB
| DMA period | DMA value | | 5 day DMA | 17.47 | | 12 day DMA | 17.75 | | 20 day DMA | 18.19 | | 35 day DMA | 18.79 | | 50 day DMA | 19.14 | | 100 day DMA | 18.47 | | 150 day DMA | 17.66 | | 200 day DMA | 17.86 | EMA (exponential moving average) of Rbb Bancorp RBB
| EMA period | EMA current | EMA prev | EMA prev2 | | 5 day EMA | 17.43 | 17.34 | 17.5 | | 12 day EMA | 17.75 | 17.77 | 17.9 | | 20 day EMA | 18.07 | 18.12 | 18.23 | | 35 day EMA | 18.49 | 18.54 | 18.63 | | 50 day EMA | 18.93 | 18.98 | 19.06 |
SMA (simple moving average) of Rbb Bancorp RBB
| SMA period | SMA current | SMA prev | SMA prev2 | | 5 day SMA | 17.47 | 17.43 | 17.48 | | 12 day SMA | 17.75 | 17.8 | 17.91 | | 20 day SMA | 18.19 | 18.28 | 18.4 | | 35 day SMA | 18.79 | 18.86 | 18.95 | | 50 day SMA | 19.14 | 19.16 | 19.18 | | 100 day SMA | 18.47 | 18.46 | 18.45 | | 150 day SMA | 17.66 | 17.66 | 17.66 | | 200 day SMA | 17.86 | 17.87 | 17.89 |
|
|
