RandCapital RAND full analysis,charts,indicators,moving averages,SMA,DMA,EMA,ADX,MACD,RSIRand Capital RAND WideScreen charts, DMA,SMA,EMA technical analysis, forecast prediction, by indicators ADX,MACD,RSI,CCI USA stock exchange
operates under Consumer Non Durables sector & deals in Textiles
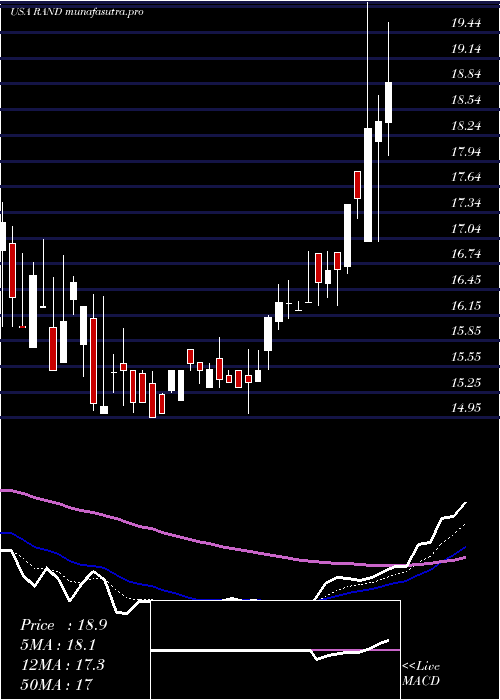
Daily price and charts and targets RandCapital Strong Daily Stock price targets for RandCapital RAND are 14.02 and 14.96 | Daily Target 1 | 13.23 | | Daily Target 2 | 13.86 | | Daily Target 3 | 14.173333333333 | | Daily Target 4 | 14.8 | | Daily Target 5 | 15.11 |
Daily price and volume Rand Capital
| Date |
Closing |
Open |
Range |
Volume |
Mon 20 October 2025 |
14.48 (6.63%) |
13.55 |
13.55 - 14.49 |
0.6414 times |
Fri 17 October 2025 |
13.58 (-2.72%) |
13.70 |
13.58 - 13.90 |
0.5539 times |
Thu 16 October 2025 |
13.96 (-0.92%) |
13.61 |
13.61 - 13.96 |
1.1079 times |
Wed 15 October 2025 |
14.09 (-0.98%) |
14.09 |
14.09 - 14.09 |
0.1749 times |
Tue 14 October 2025 |
14.23 (0.07%) |
14.48 |
13.93 - 14.48 |
0.379 times |
Mon 13 October 2025 |
14.22 (-0.21%) |
14.03 |
13.85 - 14.49 |
1.7493 times |
Fri 10 October 2025 |
14.25 (1.71%) |
14.41 |
14.00 - 14.41 |
1.9825 times |
Thu 09 October 2025 |
14.01 (-0.36%) |
14.10 |
14.01 - 14.16 |
1.7784 times |
Wed 08 October 2025 |
14.06 (-2.16%) |
14.85 |
14.06 - 14.85 |
0.9913 times |
Tue 07 October 2025 |
14.37 (2.57%) |
14.33 |
14.33 - 15.07 |
0.6414 times |
Mon 06 October 2025 |
14.01 (-6.91%) |
14.85 |
14.01 - 15.32 |
1.7449 times |
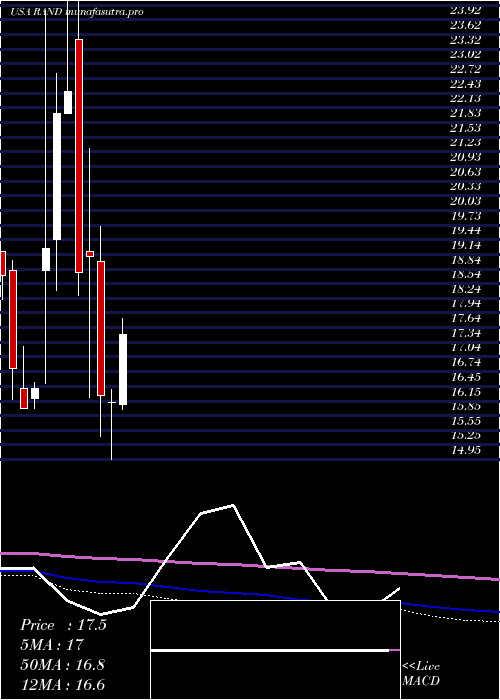
Weekly price and charts RandCapital Strong weekly Stock price targets for RandCapital RAND are 14.02 and 14.96 | Weekly Target 1 | 13.23 | | Weekly Target 2 | 13.86 | | Weekly Target 3 | 14.173333333333 | | Weekly Target 4 | 14.8 | | Weekly Target 5 | 15.11 |
Weekly price and volumes for Rand Capital
| Date |
Closing |
Open |
Range |
Volume |
Mon 20 October 2025 |
14.48 (6.63%) |
13.55 |
13.55 - 14.49 |
0.1217 times |
Fri 17 October 2025 |
13.58 (-4.7%) |
14.03 |
13.58 - 14.49 |
0.7526 times |
Fri 10 October 2025 |
14.25 (-5.32%) |
14.85 |
14.00 - 15.32 |
1.3549 times |
Fri 03 October 2025 |
15.05 (-1.12%) |
15.17 |
14.50 - 15.23 |
0.4774 times |
Fri 26 September 2025 |
15.22 (3.54%) |
14.97 |
14.61 - 15.26 |
1.1344 times |
Fri 19 September 2025 |
14.70 (0%) |
14.56 |
14.50 - 15.50 |
1.566 times |
Fri 12 September 2025 |
14.70 (-1.41%) |
15.00 |
14.55 - 15.25 |
1.0846 times |
Fri 05 September 2025 |
14.91 (-7.56%) |
15.55 |
14.54 - 16.73 |
1.638 times |
Fri 29 August 2025 |
16.13 (0%) |
15.55 |
15.55 - 16.74 |
0.3652 times |
Fri 29 August 2025 |
16.13 (3.53%) |
15.94 |
15.20 - 16.74 |
1.5051 times |
Fri 22 August 2025 |
15.58 (2.43%) |
15.95 |
15.17 - 16.45 |
0.736 times |
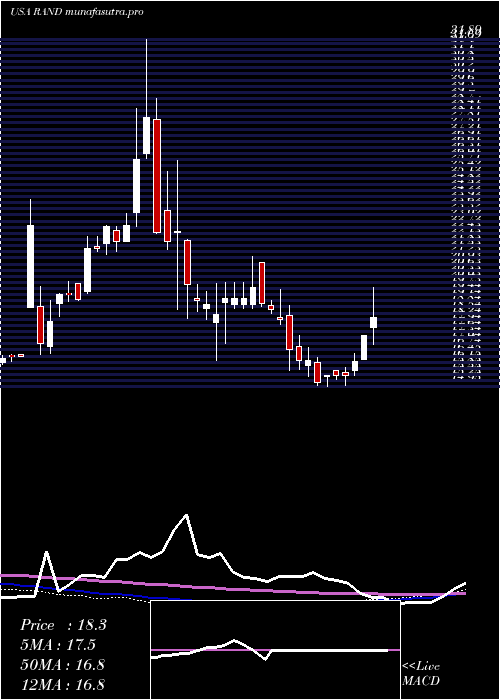
Monthly price and charts RandCapital Strong monthly Stock price targets for RandCapital RAND are 13.13 and 14.9 | Monthly Target 1 | 12.68 | | Monthly Target 2 | 13.58 | | Monthly Target 3 | 14.45 | | Monthly Target 4 | 15.35 | | Monthly Target 5 | 16.22 |
Monthly price and volumes Rand Capital
| Date |
Closing |
Open |
Range |
Volume |
Mon 20 October 2025 |
14.48 (-0.14%) |
14.79 |
13.55 - 15.32 |
0.2491 times |
Tue 30 September 2025 |
14.50 (-10.11%) |
15.55 |
14.50 - 16.73 |
0.564 times |
Fri 29 August 2025 |
16.13 (-12.1%) |
18.46 |
13.82 - 18.46 |
0.5811 times |
Thu 31 July 2025 |
18.35 (13.83%) |
16.07 |
15.98 - 20.00 |
0.6756 times |
Mon 30 June 2025 |
16.12 (-0.8%) |
16.11 |
14.95 - 16.39 |
0.6033 times |
Fri 30 May 2025 |
16.25 (-14.92%) |
19.00 |
15.43 - 19.70 |
0.6647 times |
Wed 30 April 2025 |
19.10 (1.76%) |
19.19 |
16.21 - 21.30 |
0.842 times |
Mon 31 March 2025 |
18.77 (-16.39%) |
23.52 |
18.30 - 26.00 |
1.889 times |
Fri 28 February 2025 |
22.45 (2%) |
22.01 |
22.01 - 31.89 |
2.1657 times |
Fri 31 January 2025 |
22.01 (14.34%) |
19.44 |
18.39 - 22.82 |
1.7656 times |
Tue 31 December 2024 |
19.25 (17.38%) |
18.81 |
16.50 - 24.10 |
1.3335 times |
DMA SMA EMA moving averages of Rand Capital RAND
DMA (daily moving average) of Rand Capital RAND
| DMA period | DMA value | | 5 day DMA | 14.07 | | 12 day DMA | 14.19 | | 20 day DMA | 14.43 | | 35 day DMA | 14.62 | | 50 day DMA | 14.94 | | 100 day DMA | 15.85 | | 150 day DMA | 16.79 | | 200 day DMA | 18.3 | EMA (exponential moving average) of Rand Capital RAND
| EMA period | EMA current | EMA prev | EMA prev2 | | 5 day EMA | 14.11 | 13.93 | 14.11 | | 12 day EMA | 14.22 | 14.17 | 14.28 | | 20 day EMA | 14.39 | 14.38 | 14.46 | | 35 day EMA | 14.72 | 14.73 | 14.8 | | 50 day EMA | 15.03 | 15.05 | 15.11 |
SMA (simple moving average) of Rand Capital RAND
| SMA period | SMA current | SMA prev | SMA prev2 | | 5 day SMA | 14.07 | 14.02 | 14.15 | | 12 day SMA | 14.19 | 14.23 | 14.34 | | 20 day SMA | 14.43 | 14.44 | 14.5 | | 35 day SMA | 14.62 | 14.67 | 14.74 | | 50 day SMA | 14.94 | 14.98 | 15.04 | | 100 day SMA | 15.85 | 15.86 | 15.89 | | 150 day SMA | 16.79 | 16.85 | 16.92 | | 200 day SMA | 18.3 | 18.32 | 18.34 |
|
|
