LiverampHoldings RAMP full analysis,charts,indicators,moving averages,SMA,DMA,EMA,ADX,MACD,RSILiveramp Holdings RAMP WideScreen charts, DMA,SMA,EMA technical analysis, forecast prediction, by indicators ADX,MACD,RSI,CCI USA stock exchange
operates under Technology sector & deals in EDP Services
Daily price and charts and targets LiverampHoldings Strong Daily Stock price targets for LiverampHoldings RAMP are 27.71 and 28.38 | Daily Target 1 | 27.16 | | Daily Target 2 | 27.59 | | Daily Target 3 | 27.83 | | Daily Target 4 | 28.26 | | Daily Target 5 | 28.5 |
Daily price and volume Liveramp Holdings
| Date |
Closing |
Open |
Range |
Volume |
Mon 20 October 2025 |
28.02 (2.6%) |
27.56 |
27.40 - 28.07 |
0.3654 times |
Fri 17 October 2025 |
27.31 (0.33%) |
27.08 |
26.85 - 27.37 |
0.9936 times |
Thu 16 October 2025 |
27.22 (-0.44%) |
27.57 |
27.17 - 27.83 |
0.9501 times |
Wed 15 October 2025 |
27.34 (-0.47%) |
27.71 |
27.09 - 27.71 |
1.0657 times |
Tue 14 October 2025 |
27.47 (1.14%) |
26.71 |
26.52 - 27.60 |
1.1726 times |
Mon 13 October 2025 |
27.16 (-0.18%) |
27.14 |
26.80 - 27.36 |
1.203 times |
Tue 07 October 2025 |
27.21 (-2.86%) |
28.09 |
27.06 - 28.27 |
1.4379 times |
Mon 06 October 2025 |
28.01 (2.19%) |
27.55 |
27.49 - 28.32 |
1.0797 times |
Fri 03 October 2025 |
27.41 (1.82%) |
26.95 |
26.95 - 27.63 |
1.1914 times |
Thu 02 October 2025 |
26.92 (0.26%) |
26.87 |
26.64 - 27.17 |
0.5405 times |
Wed 01 October 2025 |
26.85 (-1.07%) |
26.90 |
26.80 - 27.66 |
1.0701 times |
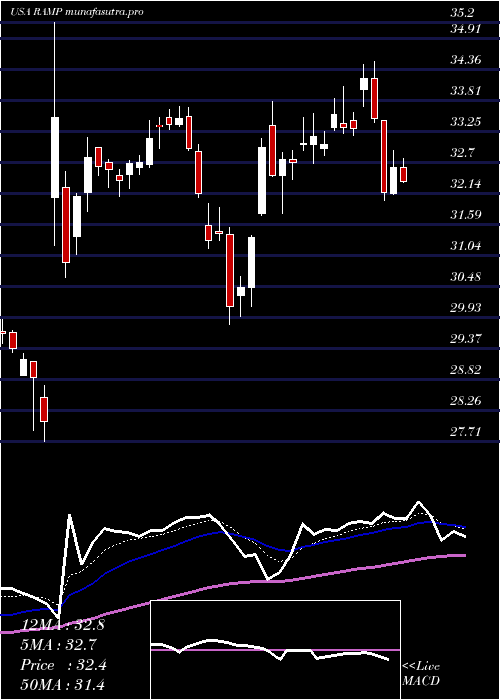
Weekly price and charts LiverampHoldings Strong weekly Stock price targets for LiverampHoldings RAMP are 27.71 and 28.38 | Weekly Target 1 | 27.16 | | Weekly Target 2 | 27.59 | | Weekly Target 3 | 27.83 | | Weekly Target 4 | 28.26 | | Weekly Target 5 | 28.5 |
Weekly price and volumes for Liveramp Holdings
| Date |
Closing |
Open |
Range |
Volume |
Mon 20 October 2025 |
28.02 (2.6%) |
27.56 |
27.40 - 28.07 |
0.0788 times |
Fri 17 October 2025 |
27.31 (0.37%) |
27.14 |
26.52 - 27.83 |
1.1618 times |
Tue 07 October 2025 |
27.21 (-0.73%) |
27.55 |
27.06 - 28.32 |
0.5431 times |
Fri 03 October 2025 |
27.41 (-2.63%) |
28.43 |
26.64 - 28.45 |
1.0946 times |
Fri 26 September 2025 |
28.15 (2.03%) |
27.44 |
27.12 - 28.78 |
1.2461 times |
Fri 19 September 2025 |
27.59 (4.51%) |
26.49 |
26.15 - 27.94 |
1.3895 times |
Fri 12 September 2025 |
26.40 (-6.98%) |
28.40 |
26.36 - 28.43 |
1.2668 times |
Fri 05 September 2025 |
28.38 (1.65%) |
27.32 |
26.85 - 28.73 |
1.1752 times |
Fri 29 August 2025 |
27.92 (0%) |
27.64 |
27.60 - 28.15 |
0.3974 times |
Fri 29 August 2025 |
27.92 (0.04%) |
27.74 |
26.72 - 28.15 |
1.6467 times |
Fri 22 August 2025 |
27.91 (4.81%) |
26.78 |
26.29 - 27.98 |
1.2889 times |
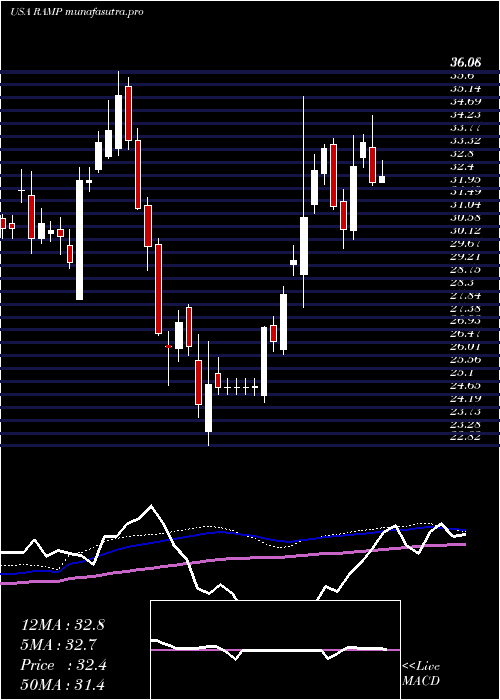
Monthly price and charts LiverampHoldings Strong monthly Stock price targets for LiverampHoldings RAMP are 27.27 and 29.07 | Monthly Target 1 | 25.82 | | Monthly Target 2 | 26.92 | | Monthly Target 3 | 27.62 | | Monthly Target 4 | 28.72 | | Monthly Target 5 | 29.42 |
Monthly price and volumes Liveramp Holdings
| Date |
Closing |
Open |
Range |
Volume |
Mon 20 October 2025 |
28.02 (3.24%) |
26.90 |
26.52 - 28.32 |
0.4889 times |
Tue 30 September 2025 |
27.14 (-2.79%) |
27.32 |
26.15 - 28.78 |
1.1397 times |
Fri 29 August 2025 |
27.92 (-14.93%) |
32.32 |
25.07 - 32.89 |
1.4738 times |
Thu 31 July 2025 |
32.82 (-0.67%) |
33.02 |
32.03 - 34.50 |
0.7037 times |
Mon 30 June 2025 |
33.04 (1.41%) |
32.47 |
29.80 - 33.80 |
0.8313 times |
Fri 30 May 2025 |
32.58 (24.54%) |
26.45 |
26.07 - 35.20 |
1.2571 times |
Wed 30 April 2025 |
26.16 (0.08%) |
26.07 |
22.82 - 27.41 |
0.909 times |
Mon 31 March 2025 |
26.14 (-12.52%) |
29.95 |
24.97 - 30.16 |
1.2266 times |
Fri 28 February 2025 |
29.88 (-12.12%) |
33.36 |
29.03 - 36.08 |
0.9899 times |
Fri 31 January 2025 |
34.00 (11.95%) |
30.69 |
27.99 - 35.05 |
0.98 times |
Tue 31 December 2024 |
30.37 (-0.49%) |
31.85 |
29.64 - 32.60 |
0.6733 times |
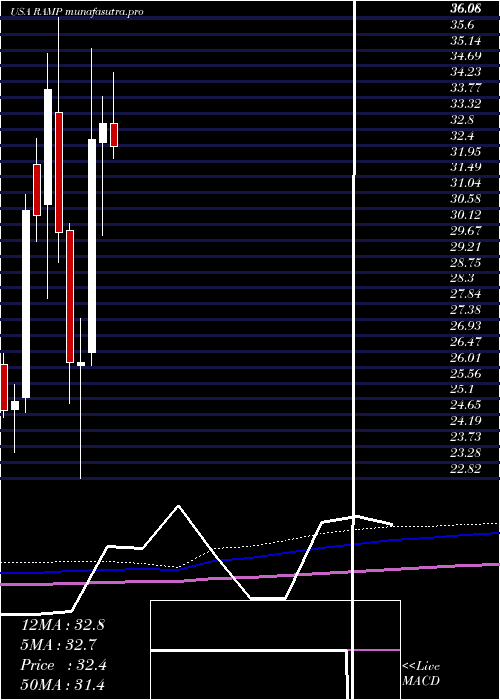
DMA SMA EMA moving averages of Liveramp Holdings RAMP
DMA (daily moving average) of Liveramp Holdings RAMP
| DMA period | DMA value | | 5 day DMA | 27.47 | | 12 day DMA | 27.34 | | 20 day DMA | 27.57 | | 35 day DMA | 27.43 | | 50 day DMA | 27.24 | | 100 day DMA | 29.95 | | 150 day DMA | 28.82 | | 200 day DMA | 29.51 | EMA (exponential moving average) of Liveramp Holdings RAMP
| EMA period | EMA current | EMA prev | EMA prev2 | | 5 day EMA | 27.55 | 27.32 | 27.32 | | 12 day EMA | 27.48 | 27.38 | 27.39 | | 20 day EMA | 27.5 | 27.44 | 27.45 | | 35 day EMA | 27.6 | 27.58 | 27.6 | | 50 day EMA | 27.69 | 27.68 | 27.69 |
SMA (simple moving average) of Liveramp Holdings RAMP
| SMA period | SMA current | SMA prev | SMA prev2 | | 5 day SMA | 27.47 | 27.3 | 27.28 | | 12 day SMA | 27.34 | 27.36 | 27.43 | | 20 day SMA | 27.57 | 27.51 | 27.47 | | 35 day SMA | 27.43 | 27.41 | 27.41 | | 50 day SMA | 27.24 | 27.33 | 27.42 | | 100 day SMA | 29.95 | 29.95 | 29.97 | | 150 day SMA | 28.82 | 28.81 | 28.8 | | 200 day SMA | 29.51 | 29.52 | 29.54 |
|
|
