FerrariN RACE full analysis,charts,indicators,moving averages,SMA,DMA,EMA,ADX,MACD,RSIFerrari N RACE WideScreen charts, DMA,SMA,EMA technical analysis, forecast prediction, by indicators ADX,MACD,RSI,CCI USA stock exchange
operates under Capital Goods sector & deals in Auto Manufacturing
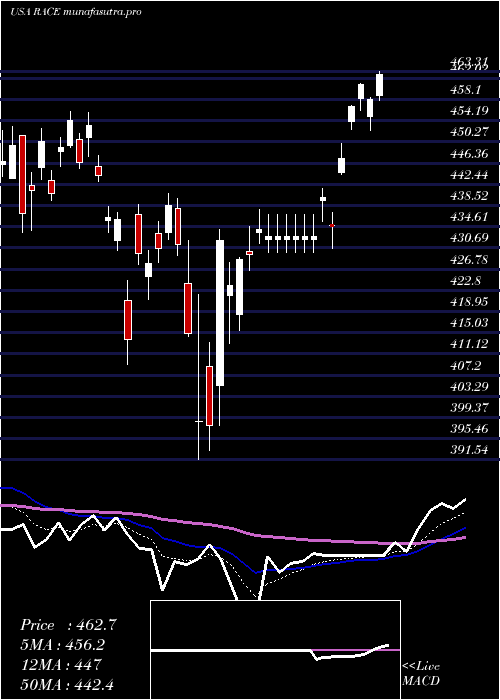
Daily price and charts and targets FerrariN Strong Daily Stock price targets for FerrariN RACE are 396.08 and 401.29 | Daily Target 1 | 391.86 | | Daily Target 2 | 395.08 | | Daily Target 3 | 397.06666666667 | | Daily Target 4 | 400.29 | | Daily Target 5 | 402.28 |
Daily price and volume Ferrari N
| Date |
Closing |
Open |
Range |
Volume |
Mon 20 October 2025 |
398.31 (-0.17%) |
395.70 |
393.84 - 399.05 |
0.3776 times |
Fri 17 October 2025 |
399.00 (1.67%) |
391.22 |
391.22 - 400.85 |
0.3621 times |
Thu 16 October 2025 |
392.46 (0.74%) |
393.27 |
390.78 - 400.28 |
0.8025 times |
Wed 15 October 2025 |
389.56 (1.93%) |
381.13 |
379.69 - 391.76 |
0.9022 times |
Tue 14 October 2025 |
382.19 (0.92%) |
375.81 |
372.31 - 386.61 |
1.0813 times |
Mon 13 October 2025 |
378.72 (-4.3%) |
386.71 |
377.64 - 387.14 |
1.5428 times |
Fri 10 October 2025 |
395.72 (-2.86%) |
412.24 |
393.38 - 412.98 |
1.54 times |
Thu 09 October 2025 |
407.38 (-14.99%) |
419.18 |
402.86 - 422.90 |
2.8647 times |
Wed 08 October 2025 |
479.21 (-2.37%) |
488.17 |
477.01 - 490.54 |
0.2871 times |
Tue 07 October 2025 |
490.86 (-0.84%) |
493.42 |
488.99 - 495.00 |
0.2397 times |
Mon 06 October 2025 |
495.00 (-1.23%) |
499.75 |
490.47 - 501.40 |
0.1269 times |
Weekly price and charts FerrariN Strong weekly Stock price targets for FerrariN RACE are 396.08 and 401.29 | Weekly Target 1 | 391.86 | | Weekly Target 2 | 395.08 | | Weekly Target 3 | 397.06666666667 | | Weekly Target 4 | 400.29 | | Weekly Target 5 | 402.28 |
Weekly price and volumes for Ferrari N
| Date |
Closing |
Open |
Range |
Volume |
Mon 20 October 2025 |
398.31 (-0.17%) |
395.70 |
393.84 - 399.05 |
0.2434 times |
Fri 17 October 2025 |
399.00 (0.83%) |
386.71 |
372.31 - 400.85 |
3.0233 times |
Fri 10 October 2025 |
395.72 (-21.04%) |
499.75 |
393.38 - 501.40 |
3.2602 times |
Fri 03 October 2025 |
501.15 (5.43%) |
481.63 |
480.11 - 504.49 |
0.6141 times |
Fri 26 September 2025 |
475.36 (-0.88%) |
474.30 |
468.83 - 491.01 |
0.612 times |
Fri 19 September 2025 |
479.59 (0.33%) |
478.27 |
467.47 - 488.71 |
0.6635 times |
Fri 12 September 2025 |
478.00 (-2.2%) |
484.00 |
472.66 - 485.78 |
0.5549 times |
Fri 05 September 2025 |
488.77 (2.42%) |
482.90 |
482.30 - 498.70 |
0.5066 times |
Fri 29 August 2025 |
477.21 (0%) |
477.12 |
475.22 - 478.28 |
0.0708 times |
Fri 29 August 2025 |
477.21 (1.31%) |
470.96 |
466.38 - 480.22 |
0.4513 times |
Fri 22 August 2025 |
471.02 (2.27%) |
461.00 |
459.78 - 476.56 |
0.676 times |
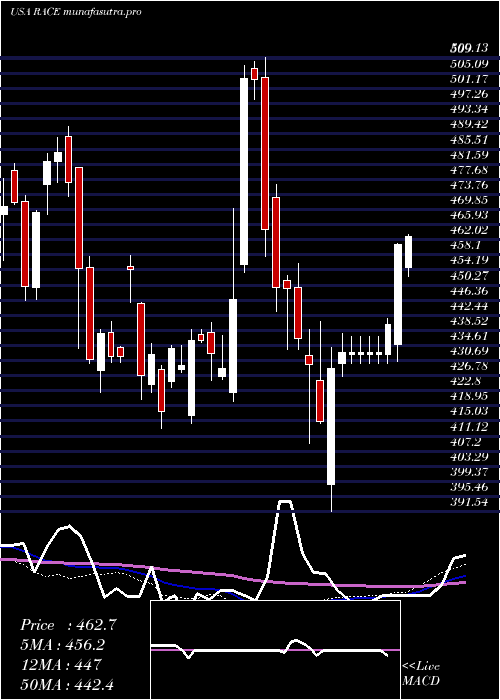
Monthly price and charts FerrariN Strong monthly Stock price targets for FerrariN RACE are 319.22 and 451.4 | Monthly Target 1 | 292.86 | | Monthly Target 2 | 345.58 | | Monthly Target 3 | 425.03666666667 | | Monthly Target 4 | 477.76 | | Monthly Target 5 | 557.22 |
Monthly price and volumes Ferrari N
| Date |
Closing |
Open |
Range |
Volume |
Mon 20 October 2025 |
398.31 (-17.91%) |
482.77 |
372.31 - 504.49 |
2.0012 times |
Tue 30 September 2025 |
485.22 (1.68%) |
482.90 |
467.47 - 498.70 |
0.7242 times |
Fri 29 August 2025 |
477.21 (7.63%) |
429.38 |
428.01 - 480.22 |
1.0325 times |
Thu 31 July 2025 |
443.39 (-9.65%) |
487.53 |
431.99 - 519.10 |
0.925 times |
Mon 30 June 2025 |
490.74 (2.5%) |
474.92 |
453.22 - 494.97 |
0.7247 times |
Fri 30 May 2025 |
478.76 (3.68%) |
463.62 |
458.95 - 503.10 |
0.7047 times |
Wed 30 April 2025 |
461.78 (7.92%) |
433.34 |
391.54 - 463.31 |
1.1916 times |
Mon 31 March 2025 |
427.88 (-7.9%) |
473.09 |
409.07 - 476.18 |
1.0672 times |
Fri 28 February 2025 |
464.57 (8.41%) |
422.51 |
419.96 - 509.13 |
0.9911 times |
Fri 31 January 2025 |
428.52 (0.87%) |
420.93 |
413.17 - 440.60 |
0.6377 times |
Tue 31 December 2024 |
424.84 (-1.59%) |
455.09 |
420.63 - 457.99 |
0.4045 times |

DMA SMA EMA moving averages of Ferrari N RACE
DMA (daily moving average) of Ferrari N RACE
| DMA period | DMA value | | 5 day DMA | 392.3 | | 12 day DMA | 425.8 | | 20 day DMA | 449.34 | | 35 day DMA | 463.36 | | 50 day DMA | 464.39 | | 100 day DMA | 472.72 | | 150 day DMA | 466.07 | | 200 day DMA | 462.99 | EMA (exponential moving average) of Ferrari N RACE
| EMA period | EMA current | EMA prev | EMA prev2 | | 5 day EMA | 398.44 | 398.5 | 398.25 | | 12 day EMA | 418.09 | 421.68 | 425.8 | | 20 day EMA | 434.17 | 437.94 | 442.04 | | 35 day EMA | 447.31 | 450.2 | 453.21 | | 50 day EMA | 455.6 | 457.94 | 460.34 |
SMA (simple moving average) of Ferrari N RACE
| SMA period | SMA current | SMA prev | SMA prev2 | | 5 day SMA | 392.3 | 388.39 | 387.73 | | 12 day SMA | 425.8 | 434.61 | 442.22 | | 20 day SMA | 449.34 | 453.31 | 457.34 | | 35 day SMA | 463.36 | 465.61 | 467.85 | | 50 day SMA | 464.39 | 465.25 | 466.14 | | 100 day SMA | 472.72 | 473.57 | 474.35 | | 150 day SMA | 466.07 | 466.4 | 466.76 | | 200 day SMA | 462.99 | 463.13 | 463.23 |
|
|
