BrookfieldReal RA full analysis,charts,indicators,moving averages,SMA,DMA,EMA,ADX,MACD,RSIBrookfield Real RA WideScreen charts, DMA,SMA,EMA technical analysis, forecast prediction, by indicators ADX,MACD,RSI,CCI USA stock exchange
operates under N A sector & deals in N A
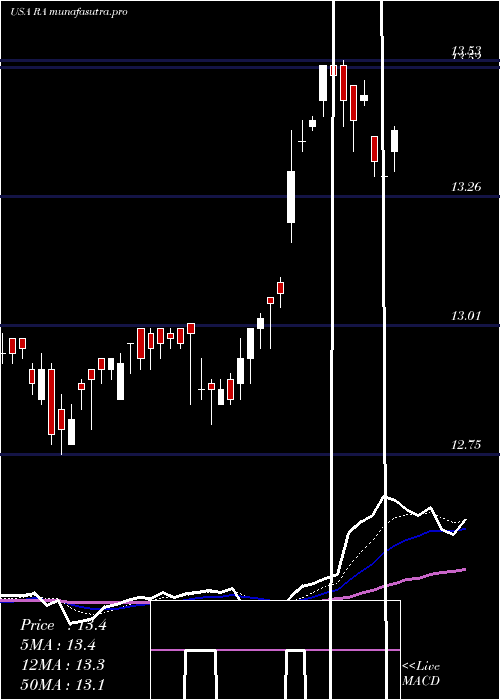
Daily price and charts and targets BrookfieldReal Strong Daily Stock price targets for BrookfieldReal RA are 13.07 and 13.14 | Daily Target 1 | 13.01 | | Daily Target 2 | 13.05 | | Daily Target 3 | 13.076666666667 | | Daily Target 4 | 13.12 | | Daily Target 5 | 13.15 |
Daily price and volume Brookfield Real
| Date |
Closing |
Open |
Range |
Volume |
Mon 20 October 2025 |
13.10 (0.31%) |
13.06 |
13.03 - 13.10 |
1.5681 times |
Fri 17 October 2025 |
13.06 (-0.53%) |
13.16 |
12.98 - 13.18 |
1.2944 times |
Thu 16 October 2025 |
13.13 (-0.08%) |
13.19 |
13.08 - 13.24 |
0.7518 times |
Wed 15 October 2025 |
13.14 (-0.53%) |
13.29 |
13.14 - 13.35 |
1.1594 times |
Tue 14 October 2025 |
13.21 (-0.97%) |
13.33 |
13.20 - 13.35 |
1.0423 times |
Mon 13 October 2025 |
13.34 (0.68%) |
13.30 |
13.26 - 13.36 |
0.6636 times |
Fri 10 October 2025 |
13.25 (-1.49%) |
13.39 |
13.24 - 13.42 |
1.0184 times |
Thu 09 October 2025 |
13.45 (-0.81%) |
13.57 |
13.42 - 13.59 |
0.8418 times |
Wed 08 October 2025 |
13.56 (0.44%) |
13.55 |
13.51 - 13.59 |
0.9107 times |
Tue 07 October 2025 |
13.50 (0.45%) |
13.47 |
13.44 - 13.54 |
0.7496 times |
Mon 06 October 2025 |
13.44 (-0.44%) |
13.46 |
13.39 - 13.52 |
0.7716 times |
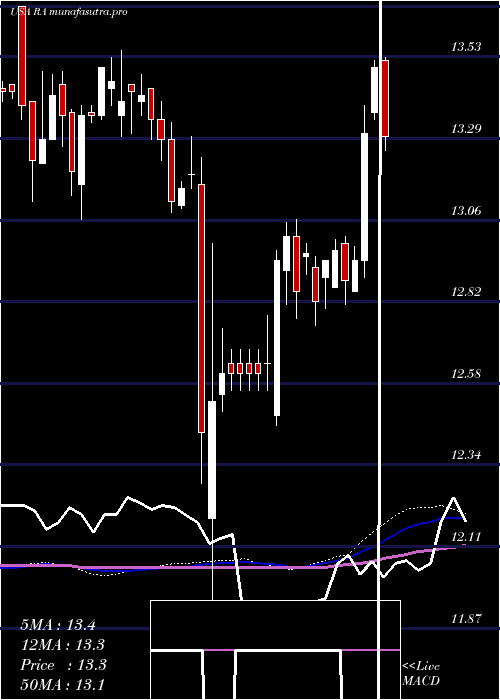
Weekly price and charts BrookfieldReal Strong weekly Stock price targets for BrookfieldReal RA are 13.07 and 13.14 | Weekly Target 1 | 13.01 | | Weekly Target 2 | 13.05 | | Weekly Target 3 | 13.076666666667 | | Weekly Target 4 | 13.12 | | Weekly Target 5 | 13.15 |
Weekly price and volumes for Brookfield Real
| Date |
Closing |
Open |
Range |
Volume |
Mon 20 October 2025 |
13.10 (0.31%) |
13.06 |
13.03 - 13.10 |
0.4061 times |
Fri 17 October 2025 |
13.06 (-1.43%) |
13.30 |
12.98 - 13.36 |
1.272 times |
Fri 10 October 2025 |
13.25 (-1.85%) |
13.46 |
13.24 - 13.59 |
1.1116 times |
Fri 03 October 2025 |
13.50 (0.82%) |
13.40 |
13.28 - 13.54 |
1.4362 times |
Fri 26 September 2025 |
13.39 (0.37%) |
13.39 |
13.17 - 13.43 |
1.7779 times |
Fri 19 September 2025 |
13.34 (-0.45%) |
13.38 |
13.33 - 13.45 |
1.017 times |
Fri 12 September 2025 |
13.40 (-1.18%) |
13.58 |
13.34 - 13.59 |
0.9668 times |
Fri 05 September 2025 |
13.56 (0.3%) |
13.44 |
13.44 - 13.58 |
0.73 times |
Fri 29 August 2025 |
13.52 (0%) |
13.52 |
13.48 - 13.55 |
0.1792 times |
Fri 29 August 2025 |
13.52 (1.27%) |
13.36 |
13.31 - 13.55 |
1.1032 times |
Fri 22 August 2025 |
13.35 (1.68%) |
13.12 |
13.12 - 13.35 |
1.1047 times |
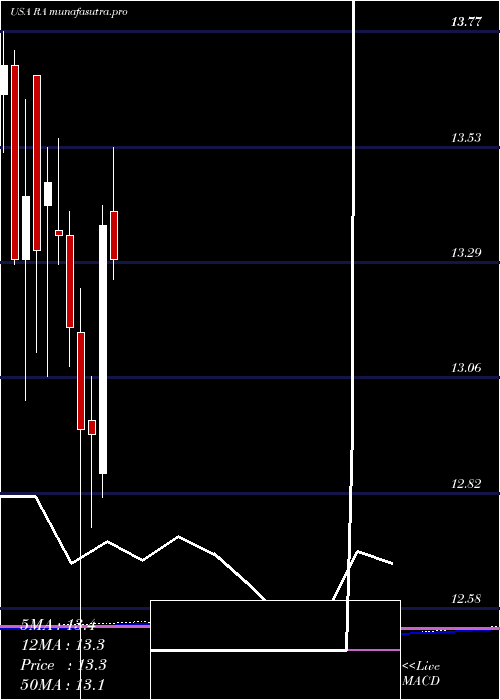
Monthly price and charts BrookfieldReal Strong monthly Stock price targets for BrookfieldReal RA are 12.74 and 13.35 | Monthly Target 1 | 12.61 | | Monthly Target 2 | 12.86 | | Monthly Target 3 | 13.223333333333 | | Monthly Target 4 | 13.47 | | Monthly Target 5 | 13.83 |
Monthly price and volumes Brookfield Real
| Date |
Closing |
Open |
Range |
Volume |
Mon 20 October 2025 |
13.10 (-1.95%) |
13.36 |
12.98 - 13.59 |
0.6859 times |
Tue 30 September 2025 |
13.36 (-1.18%) |
13.44 |
13.17 - 13.59 |
0.9787 times |
Fri 29 August 2025 |
13.52 (2.11%) |
13.26 |
13.08 - 13.55 |
0.9006 times |
Thu 31 July 2025 |
13.24 (-0.97%) |
13.40 |
13.11 - 13.53 |
1.2181 times |
Mon 30 June 2025 |
13.37 (3.32%) |
12.86 |
12.81 - 13.41 |
1.0256 times |
Fri 30 May 2025 |
12.94 (-0.08%) |
12.97 |
12.75 - 13.06 |
0.7528 times |
Wed 30 April 2025 |
12.95 (-1.6%) |
13.15 |
11.87 - 13.24 |
1.1622 times |
Mon 31 March 2025 |
13.16 (-1.42%) |
13.35 |
13.08 - 13.40 |
1.0903 times |
Fri 28 February 2025 |
13.35 (-0.82%) |
13.36 |
13.29 - 13.55 |
0.96 times |
Fri 31 January 2025 |
13.46 (1.05%) |
13.41 |
13.06 - 13.53 |
1.2257 times |
Tue 31 December 2024 |
13.32 (-0.82%) |
13.68 |
13.11 - 13.68 |
1.1038 times |
DMA SMA EMA moving averages of Brookfield Real RA
DMA (daily moving average) of Brookfield Real RA
| DMA period | DMA value | | 5 day DMA | 13.13 | | 12 day DMA | 13.31 | | 20 day DMA | 13.34 | | 35 day DMA | 13.39 | | 50 day DMA | 13.37 | | 100 day DMA | 13.26 | | 150 day DMA | 13.12 | | 200 day DMA | 13.18 | EMA (exponential moving average) of Brookfield Real RA
| EMA period | EMA current | EMA prev | EMA prev2 | | 5 day EMA | 13.15 | 13.17 | 13.22 | | 12 day EMA | 13.25 | 13.28 | 13.32 | | 20 day EMA | 13.3 | 13.32 | 13.35 | | 35 day EMA | 13.33 | 13.34 | 13.36 | | 50 day EMA | 13.33 | 13.34 | 13.35 |
SMA (simple moving average) of Brookfield Real RA
| SMA period | SMA current | SMA prev | SMA prev2 | | 5 day SMA | 13.13 | 13.18 | 13.21 | | 12 day SMA | 13.31 | 13.34 | 13.38 | | 20 day SMA | 13.34 | 13.36 | 13.37 | | 35 day SMA | 13.39 | 13.4 | 13.41 | | 50 day SMA | 13.37 | 13.37 | 13.37 | | 100 day SMA | 13.26 | 13.26 | 13.26 | | 150 day SMA | 13.12 | 13.12 | 13.12 | | 200 day SMA | 13.18 | 13.18 | 13.18 |
|
|
