GlobalX QYLD full analysis,charts,indicators,moving averages,SMA,DMA,EMA,ADX,MACD,RSIGlobal X QYLD WideScreen charts, DMA,SMA,EMA technical analysis, forecast prediction, by indicators ADX,MACD,RSI,CCI USA stock exchange
operates under N A sector & deals in N A
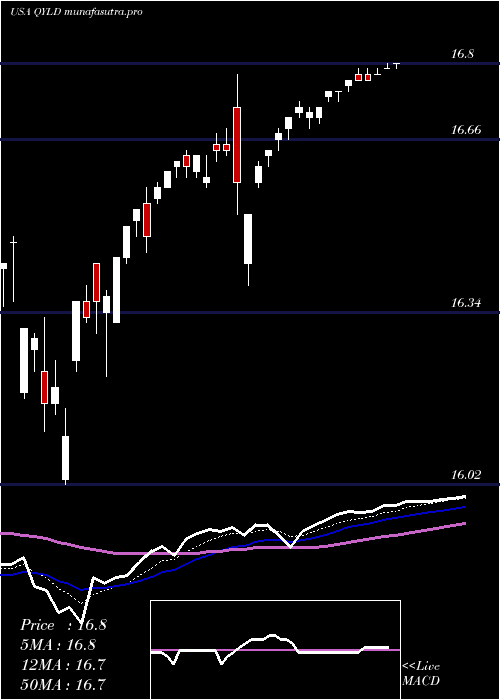
Daily price and charts and targets GlobalX Strong Daily Stock price targets for GlobalX QYLD are 17.5 and 17.55 | Daily Target 1 | 17.45 | | Daily Target 2 | 17.49 | | Daily Target 3 | 17.503333333333 | | Daily Target 4 | 17.54 | | Daily Target 5 | 17.55 |
Daily price and volume Global X
| Date |
Closing |
Open |
Range |
Volume |
Thu 04 December 2025 |
17.52 (0.06%) |
17.51 |
17.47 - 17.52 |
0.4857 times |
Wed 03 December 2025 |
17.51 (0.06%) |
17.49 |
17.48 - 17.51 |
0.604 times |
Tue 02 December 2025 |
17.50 (0.17%) |
17.49 |
17.47 - 17.50 |
0.6993 times |
Mon 01 December 2025 |
17.47 (0%) |
17.44 |
17.43 - 17.48 |
0.4903 times |
Fri 28 November 2025 |
17.47 (0.23%) |
17.44 |
17.43 - 17.47 |
0.4784 times |
Wed 26 November 2025 |
17.43 (0.29%) |
17.38 |
17.35 - 17.44 |
0.9914 times |
Tue 25 November 2025 |
17.38 (0.29%) |
17.32 |
17.25 - 17.39 |
1.412 times |
Mon 24 November 2025 |
17.33 (0.12%) |
17.23 |
17.16 - 17.34 |
1.278 times |
Fri 21 November 2025 |
17.31 (0.99%) |
17.20 |
17.02 - 17.39 |
1.6224 times |
Thu 20 November 2025 |
17.14 (-1.55%) |
17.55 |
17.14 - 17.57 |
1.9385 times |
Wed 19 November 2025 |
17.41 (0.52%) |
17.35 |
17.32 - 17.48 |
1.2705 times |
Weekly price and charts GlobalX Strong weekly Stock price targets for GlobalX QYLD are 17.48 and 17.57 | Weekly Target 1 | 17.4 | | Weekly Target 2 | 17.46 | | Weekly Target 3 | 17.49 | | Weekly Target 4 | 17.55 | | Weekly Target 5 | 17.58 |
Weekly price and volumes for Global X
| Date |
Closing |
Open |
Range |
Volume |
Thu 04 December 2025 |
17.52 (0.29%) |
17.44 |
17.43 - 17.52 |
0.4648 times |
Fri 28 November 2025 |
17.47 (0.92%) |
17.23 |
17.16 - 17.47 |
0.8483 times |
Fri 21 November 2025 |
17.31 (-0.69%) |
17.40 |
17.02 - 17.57 |
1.5261 times |
Fri 14 November 2025 |
17.43 (0.4%) |
17.42 |
17.24 - 17.52 |
1.0176 times |
Fri 07 November 2025 |
17.36 (-0.4%) |
17.41 |
17.20 - 17.47 |
1.0626 times |
Fri 31 October 2025 |
17.43 (0%) |
17.46 |
17.40 - 17.47 |
0.2653 times |
Fri 31 October 2025 |
17.43 (0.46%) |
17.41 |
17.40 - 17.47 |
1.1197 times |
Fri 24 October 2025 |
17.35 (0.29%) |
17.25 |
17.11 - 17.36 |
1.1427 times |
Fri 17 October 2025 |
17.30 (2.49%) |
17.07 |
16.94 - 17.35 |
1.5072 times |
Fri 10 October 2025 |
16.88 (-1.06%) |
17.11 |
16.88 - 17.18 |
1.0458 times |
Fri 03 October 2025 |
17.06 (0.83%) |
16.98 |
16.95 - 17.10 |
0.7972 times |
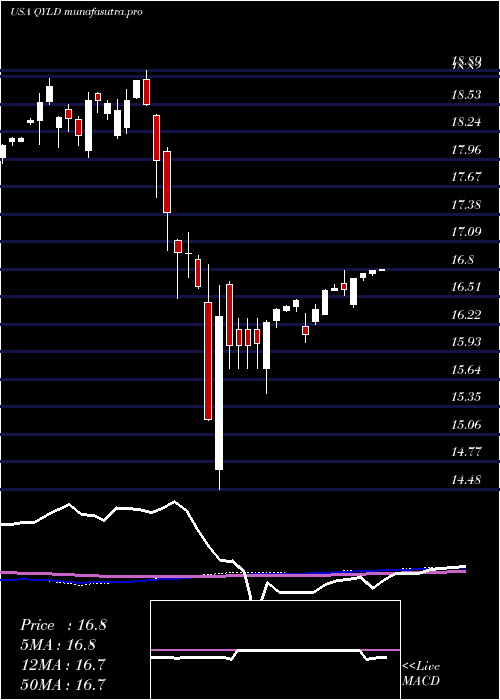
Monthly price and charts GlobalX Strong monthly Stock price targets for GlobalX QYLD are 17.48 and 17.57 | Monthly Target 1 | 17.4 | | Monthly Target 2 | 17.46 | | Monthly Target 3 | 17.49 | | Monthly Target 4 | 17.55 | | Monthly Target 5 | 17.58 |
Monthly price and volumes Global X
| Date |
Closing |
Open |
Range |
Volume |
Thu 04 December 2025 |
17.52 (0.29%) |
17.44 |
17.43 - 17.52 |
0.1189 times |
Fri 28 November 2025 |
17.47 (0.23%) |
17.41 |
17.02 - 17.57 |
1.1399 times |
Fri 31 October 2025 |
17.43 (2.47%) |
16.97 |
16.88 - 17.47 |
1.4023 times |
Tue 30 September 2025 |
17.01 (2.22%) |
16.50 |
16.42 - 17.10 |
0.9454 times |
Fri 29 August 2025 |
16.64 (-0.66%) |
16.67 |
16.35 - 16.95 |
0.9157 times |
Thu 31 July 2025 |
16.75 (0.18%) |
16.70 |
16.58 - 16.84 |
0.6691 times |
Mon 30 June 2025 |
16.72 (2.14%) |
16.32 |
16.32 - 16.78 |
0.6148 times |
Fri 30 May 2025 |
16.37 (0.43%) |
16.33 |
16.02 - 16.48 |
0.8181 times |
Wed 30 April 2025 |
16.30 (-1.98%) |
16.60 |
14.48 - 16.85 |
1.8772 times |
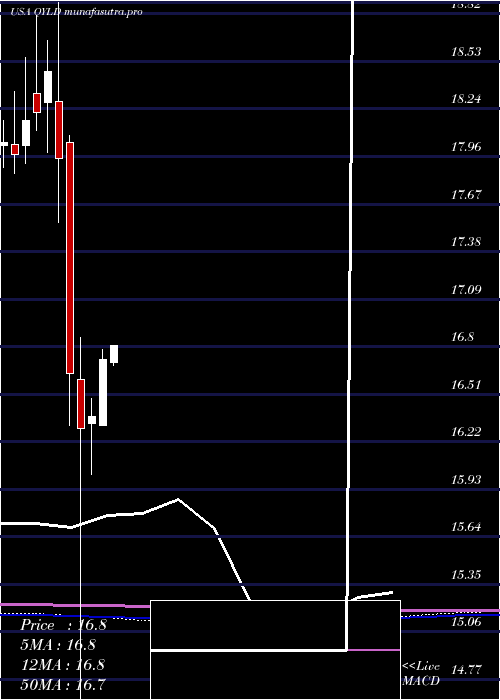
Mon 31 March 2025 |
16.63 (-7.3%) |
18.04 |
16.32 - 18.08 |
1.4986 times |
Fri 28 February 2025 |
17.94 (-2.87%) |
18.29 |
17.55 - 18.89 |
0.9608 times |
DMA SMA EMA moving averages of Global X QYLD
DMA (daily moving average) of Global X QYLD
| DMA period | DMA value | | 5 day DMA | 17.49 | | 12 day DMA | 17.4 | | 20 day DMA | 17.41 | | 35 day DMA | 17.38 | | 50 day DMA | 17.28 | | 100 day DMA | 17.04 | | 150 day DMA | 16.87 | | 200 day DMA | 16.85 | EMA (exponential moving average) of Global X QYLD
| EMA period | EMA current | EMA prev | EMA prev2 | | 5 day EMA | 17.49 | 17.47 | 17.45 | | 12 day EMA | 17.44 | 17.43 | 17.41 | | 20 day EMA | 17.41 | 17.4 | 17.39 | | 35 day EMA | 17.35 | 17.34 | 17.33 | | 50 day EMA | 17.28 | 17.27 | 17.26 |
SMA (simple moving average) of Global X QYLD
| SMA period | SMA current | SMA prev | SMA prev2 | | 5 day SMA | 17.49 | 17.48 | 17.45 | | 12 day SMA | 17.4 | 17.39 | 17.38 | | 20 day SMA | 17.41 | 17.41 | 17.4 | | 35 day SMA | 17.38 | 17.37 | 17.36 | | 50 day SMA | 17.28 | 17.27 | 17.26 | | 100 day SMA | 17.04 | 17.03 | 17.02 | | 150 day SMA | 16.87 | 16.86 | 16.85 | | 200 day SMA | 16.85 | 16.86 | 16.87 |
|
|
