RestaurantBrands QSR full analysis,charts,indicators,moving averages,SMA,DMA,EMA,ADX,MACD,RSIRestaurant Brands QSR WideScreen charts, DMA,SMA,EMA technical analysis, forecast prediction, by indicators ADX,MACD,RSI,CCI USA stock exchange
operates under Consumer Services sector & deals in Restaurants
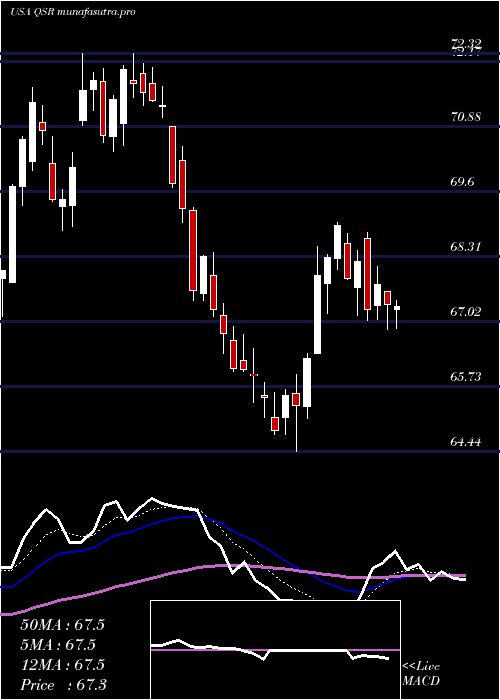
Daily price and charts and targets RestaurantBrands Strong Daily Stock price targets for RestaurantBrands QSR are 67.5 and 68.61 | Daily Target 1 | 66.67 | | Daily Target 2 | 67.22 | | Daily Target 3 | 67.783333333333 | | Daily Target 4 | 68.33 | | Daily Target 5 | 68.89 |
Daily price and volume Restaurant Brands
| Date |
Closing |
Open |
Range |
Volume |
Mon 20 October 2025 |
67.76 (0.56%) |
67.32 |
67.24 - 68.35 |
0.8621 times |
Fri 17 October 2025 |
67.38 (-0.06%) |
67.35 |
66.73 - 67.58 |
1.2054 times |
Thu 16 October 2025 |
67.42 (-2.71%) |
69.43 |
67.28 - 69.50 |
1.3736 times |
Wed 15 October 2025 |
69.30 (0.92%) |
68.75 |
68.58 - 69.46 |
0.7376 times |
Tue 14 October 2025 |
68.67 (2.81%) |
66.61 |
66.61 - 68.79 |
1.5942 times |
Mon 13 October 2025 |
66.79 (-0.7%) |
66.44 |
66.35 - 67.44 |
0.4922 times |
Tue 07 October 2025 |
67.26 (-2.34%) |
69.26 |
67.20 - 69.26 |
1.1462 times |
Mon 06 October 2025 |
68.87 (0.69%) |
68.35 |
68.14 - 69.01 |
0.8979 times |
Fri 03 October 2025 |
68.40 (1.06%) |
67.70 |
67.42 - 68.59 |
0.7054 times |
Thu 02 October 2025 |
67.68 (2.3%) |
65.95 |
65.89 - 67.79 |
0.9853 times |
Wed 01 October 2025 |
66.16 (3.15%) |
64.22 |
64.17 - 66.16 |
1.3358 times |
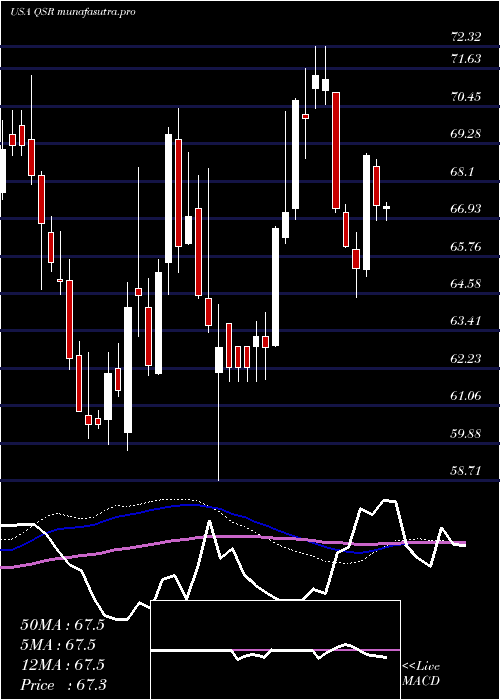
Weekly price and charts RestaurantBrands Strong weekly Stock price targets for RestaurantBrands QSR are 67.5 and 68.61 | Weekly Target 1 | 66.67 | | Weekly Target 2 | 67.22 | | Weekly Target 3 | 67.783333333333 | | Weekly Target 4 | 68.33 | | Weekly Target 5 | 68.89 |
Weekly price and volumes for Restaurant Brands
| Date |
Closing |
Open |
Range |
Volume |
Mon 20 October 2025 |
67.76 (0.56%) |
67.32 |
67.24 - 68.35 |
0.1689 times |
Fri 17 October 2025 |
67.38 (0.18%) |
66.44 |
66.35 - 69.50 |
1.0586 times |
Tue 07 October 2025 |
67.26 (-1.67%) |
68.35 |
67.20 - 69.26 |
0.4005 times |
Fri 03 October 2025 |
68.40 (5.38%) |
64.99 |
64.11 - 68.59 |
1.1236 times |
Fri 26 September 2025 |
64.91 (1.8%) |
63.89 |
63.43 - 65.10 |
1.7479 times |
Fri 19 September 2025 |
63.76 (1.34%) |
63.46 |
62.85 - 64.69 |
1.5152 times |
Fri 12 September 2025 |
62.92 (-0.29%) |
62.85 |
61.33 - 63.60 |
1.6664 times |
Fri 05 September 2025 |
63.10 (-0.36%) |
63.02 |
61.79 - 63.29 |
0.9236 times |
Fri 29 August 2025 |
63.33 (0%) |
63.10 |
62.83 - 63.43 |
0.1812 times |
Fri 29 August 2025 |
63.33 (-0.11%) |
63.16 |
62.34 - 63.50 |
1.214 times |
Fri 22 August 2025 |
63.40 (-2.89%) |
65.40 |
63.25 - 66.90 |
1.0419 times |
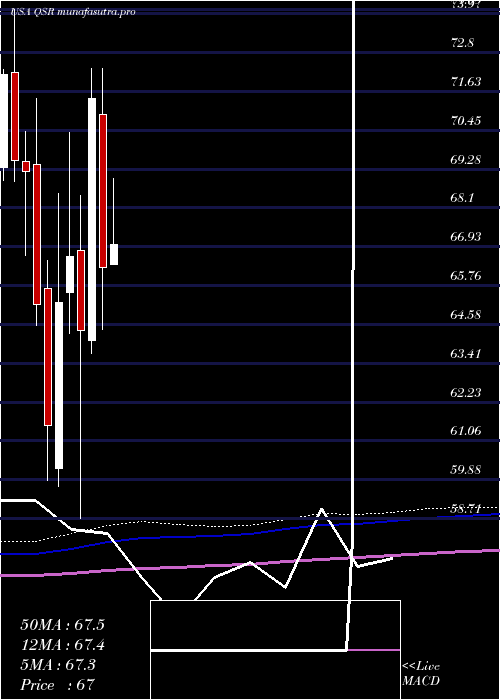
Monthly price and charts RestaurantBrands Strong monthly Stock price targets for RestaurantBrands QSR are 65.97 and 71.3 | Monthly Target 1 | 61.81 | | Monthly Target 2 | 64.79 | | Monthly Target 3 | 67.143333333333 | | Monthly Target 4 | 70.12 | | Monthly Target 5 | 72.47 |
Monthly price and volumes Restaurant Brands
| Date |
Closing |
Open |
Range |
Volume |
Mon 20 October 2025 |
67.76 (5.64%) |
64.22 |
64.17 - 69.50 |
0.4822 times |
Tue 30 September 2025 |
64.14 (1.28%) |
63.02 |
61.33 - 65.94 |
1.3861 times |
Fri 29 August 2025 |
63.33 (-6.68%) |
68.51 |
62.34 - 69.32 |
1.0571 times |
Thu 31 July 2025 |
67.86 (2.37%) |
66.38 |
66.38 - 71.77 |
0.8619 times |
Mon 30 June 2025 |
66.29 (-7.17%) |
70.94 |
64.44 - 72.32 |
1.6003 times |
Fri 30 May 2025 |
71.41 (10.89%) |
64.08 |
63.69 - 72.32 |
1.0717 times |
Wed 30 April 2025 |
64.40 (-3.36%) |
66.82 |
58.71 - 68.49 |
0.8972 times |
Mon 31 March 2025 |
66.64 (2.13%) |
65.55 |
64.30 - 70.39 |
0.821 times |
Fri 28 February 2025 |
65.25 (6.03%) |
60.22 |
59.67 - 68.54 |
0.9526 times |
Fri 31 January 2025 |
61.54 (-5.58%) |
65.67 |
59.86 - 66.52 |
0.8699 times |
Tue 31 December 2024 |
65.18 (-5.82%) |
69.42 |
64.55 - 71.42 |
0.5457 times |
DMA SMA EMA moving averages of Restaurant Brands QSR
DMA (daily moving average) of Restaurant Brands QSR
| DMA period | DMA value | | 5 day DMA | 68.11 | | 12 day DMA | 67.49 | | 20 day DMA | 66.25 | | 35 day DMA | 64.82 | | 50 day DMA | 64.71 | | 100 day DMA | 66.68 | | 150 day DMA | 66.34 | | 200 day DMA | 65.68 | EMA (exponential moving average) of Restaurant Brands QSR
| EMA period | EMA current | EMA prev | EMA prev2 | | 5 day EMA | 67.77 | 67.77 | 67.96 | | 12 day EMA | 67.26 | 67.17 | 67.13 | | 20 day EMA | 66.6 | 66.48 | 66.38 | | 35 day EMA | 65.99 | 65.89 | 65.8 | | 50 day EMA | 65.33 | 65.23 | 65.14 |
SMA (simple moving average) of Restaurant Brands QSR
| SMA period | SMA current | SMA prev | SMA prev2 | | 5 day SMA | 68.11 | 67.91 | 67.89 | | 12 day SMA | 67.49 | 67.31 | 67.1 | | 20 day SMA | 66.25 | 66.05 | 65.88 | | 35 day SMA | 64.82 | 64.67 | 64.54 | | 50 day SMA | 64.71 | 64.73 | 64.74 | | 100 day SMA | 66.68 | 66.69 | 66.73 | | 150 day SMA | 66.34 | 66.34 | 66.35 | | 200 day SMA | 65.68 | 65.67 | 65.66 |
|
|
