QuinstreetInc QNST full analysis,charts,indicators,moving averages,SMA,DMA,EMA,ADX,MACD,RSIQuinstreet Inc QNST WideScreen charts, DMA,SMA,EMA technical analysis, forecast prediction, by indicators ADX,MACD,RSI,CCI USA stock exchange
operates under Miscellaneous sector & deals in Business Services
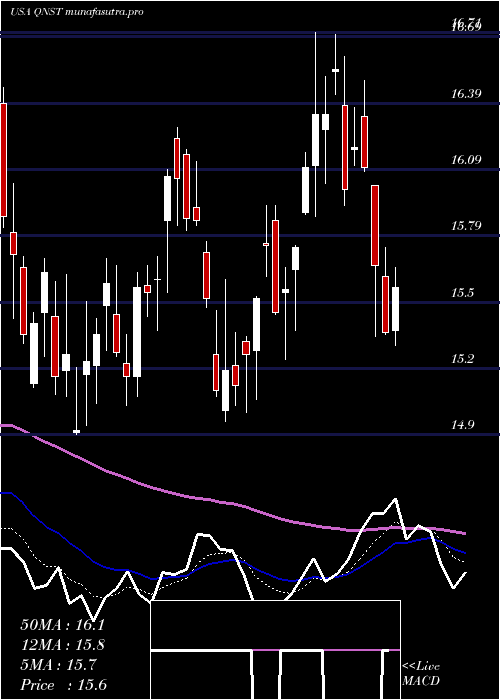
Daily price and charts and targets QuinstreetInc Strong Daily Stock price targets for QuinstreetInc QNST are 14.63 and 15.1 | Daily Target 1 | 14.26 | | Daily Target 2 | 14.52 | | Daily Target 3 | 14.726666666667 | | Daily Target 4 | 14.99 | | Daily Target 5 | 15.2 |
Daily price and volume Quinstreet Inc
| Date |
Closing |
Open |
Range |
Volume |
Tue 21 October 2025 |
14.79 (2.28%) |
14.47 |
14.46 - 14.93 |
0.9572 times |
Mon 20 October 2025 |
14.46 (1.83%) |
14.31 |
14.23 - 14.58 |
0.7292 times |
Fri 17 October 2025 |
14.20 (1.14%) |
14.01 |
13.91 - 14.35 |
0.8956 times |
Thu 16 October 2025 |
14.04 (-3.37%) |
14.50 |
13.95 - 14.57 |
0.7938 times |
Wed 15 October 2025 |
14.53 (0.9%) |
14.49 |
14.34 - 14.69 |
0.951 times |
Tue 14 October 2025 |
14.40 (4.5%) |
13.60 |
13.56 - 14.50 |
1.3952 times |
Mon 13 October 2025 |
13.78 (-0.65%) |
14.11 |
13.71 - 14.65 |
1.2192 times |
Fri 10 October 2025 |
13.87 (-7.53%) |
15.02 |
13.85 - 15.05 |
1.0809 times |
Thu 09 October 2025 |
15.00 (-0.86%) |
15.08 |
14.81 - 15.16 |
1.1855 times |
Wed 08 October 2025 |
15.13 (0.8%) |
15.09 |
15.00 - 15.26 |
0.7923 times |
Tue 07 October 2025 |
15.01 (-2.47%) |
15.41 |
14.94 - 15.47 |
1.254 times |
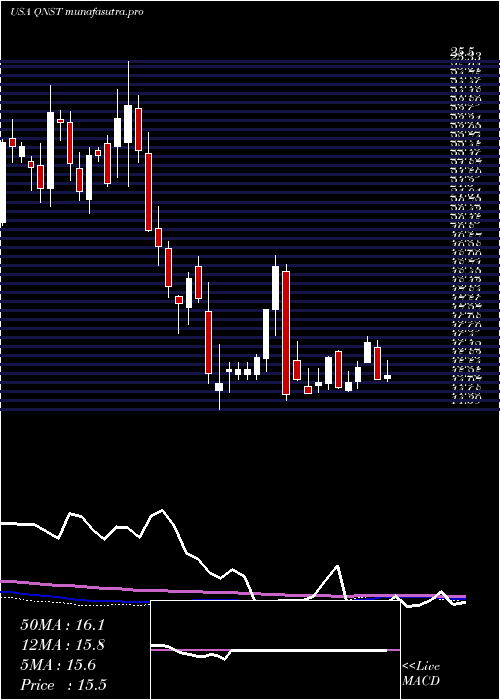
Weekly price and charts QuinstreetInc Strong weekly Stock price targets for QuinstreetInc QNST are 14.51 and 15.21 | Weekly Target 1 | 13.95 | | Weekly Target 2 | 14.37 | | Weekly Target 3 | 14.65 | | Weekly Target 4 | 15.07 | | Weekly Target 5 | 15.35 |
Weekly price and volumes for Quinstreet Inc
| Date |
Closing |
Open |
Range |
Volume |
Tue 21 October 2025 |
14.79 (4.15%) |
14.31 |
14.23 - 14.93 |
0.3929 times |
Fri 17 October 2025 |
14.20 (2.38%) |
14.11 |
13.56 - 14.69 |
1.2243 times |
Fri 10 October 2025 |
13.87 (-9.17%) |
15.56 |
13.85 - 15.94 |
1.2647 times |
Fri 03 October 2025 |
15.27 (-5.57%) |
16.20 |
15.17 - 16.20 |
1.0517 times |
Fri 26 September 2025 |
16.17 (-3.12%) |
16.72 |
15.94 - 17.05 |
0.859 times |
Fri 19 September 2025 |
16.69 (3.47%) |
16.22 |
15.83 - 17.11 |
1.2732 times |
Fri 12 September 2025 |
16.13 (1.13%) |
15.97 |
15.64 - 16.50 |
0.9129 times |
Fri 05 September 2025 |
15.95 (1.72%) |
15.44 |
15.07 - 16.21 |
1.2743 times |
Fri 29 August 2025 |
15.68 (0%) |
15.61 |
15.52 - 15.76 |
0.4641 times |
Fri 29 August 2025 |
15.68 (0.71%) |
15.50 |
15.37 - 15.89 |
1.2828 times |
Fri 22 August 2025 |
15.57 (5.63%) |
14.81 |
14.54 - 15.74 |
1.1413 times |
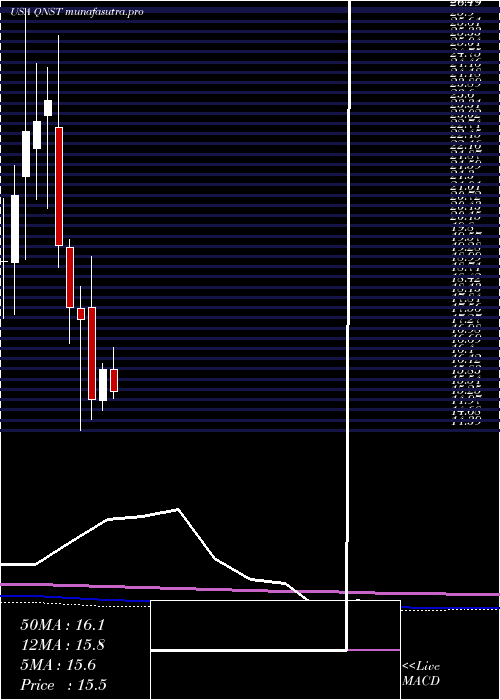
Monthly price and charts QuinstreetInc Strong monthly Stock price targets for QuinstreetInc QNST are 12.99 and 15.37 | Monthly Target 1 | 12.38 | | Monthly Target 2 | 13.59 | | Monthly Target 3 | 14.763333333333 | | Monthly Target 4 | 15.97 | | Monthly Target 5 | 17.14 |
Monthly price and volumes Quinstreet Inc
| Date |
Closing |
Open |
Range |
Volume |
Tue 21 October 2025 |
14.79 (-4.4%) |
15.31 |
13.56 - 15.94 |
0.6801 times |
Tue 30 September 2025 |
15.47 (-1.34%) |
15.44 |
15.07 - 17.11 |
0.9326 times |
Fri 29 August 2025 |
15.68 (-4.45%) |
16.19 |
14.27 - 17.12 |
1.182 times |
Thu 31 July 2025 |
16.41 (1.93%) |
16.11 |
15.02 - 16.91 |
0.9346 times |
Mon 30 June 2025 |
16.10 (5.44%) |
15.22 |
14.96 - 16.28 |
0.8036 times |
Fri 30 May 2025 |
15.27 (-12.84%) |
17.85 |
14.69 - 19.29 |
1.7669 times |
Wed 30 April 2025 |
17.52 (-1.79%) |
17.83 |
14.39 - 18.43 |
1.0428 times |
Mon 31 March 2025 |
17.84 (-8.89%) |
19.54 |
16.83 - 19.75 |
0.8361 times |
Fri 28 February 2025 |
19.58 (-17.24%) |
22.91 |
18.98 - 25.50 |
1.0435 times |
Fri 31 January 2025 |
23.66 (2.56%) |
23.25 |
20.63 - 24.59 |
0.7776 times |
Tue 31 December 2024 |
23.07 (1.23%) |
22.31 |
20.88 - 24.71 |
0.646 times |
DMA SMA EMA moving averages of Quinstreet Inc QNST
DMA (daily moving average) of Quinstreet Inc QNST
| DMA period | DMA value | | 5 day DMA | 14.4 | | 12 day DMA | 14.55 | | 20 day DMA | 15.03 | | 35 day DMA | 15.53 | | 50 day DMA | 15.46 | | 100 day DMA | 15.62 | | 150 day DMA | 15.94 | | 200 day DMA | 17.34 | EMA (exponential moving average) of Quinstreet Inc QNST
| EMA period | EMA current | EMA prev | EMA prev2 | | 5 day EMA | 14.48 | 14.33 | 14.27 | | 12 day EMA | 14.65 | 14.62 | 14.65 | | 20 day EMA | 14.9 | 14.91 | 14.96 | | 35 day EMA | 15.1 | 15.12 | 15.16 | | 50 day EMA | 15.36 | 15.38 | 15.42 |
SMA (simple moving average) of Quinstreet Inc QNST
| SMA period | SMA current | SMA prev | SMA prev2 | | 5 day SMA | 14.4 | 14.33 | 14.19 | | 12 day SMA | 14.55 | 14.59 | 14.67 | | 20 day SMA | 15.03 | 15.09 | 15.21 | | 35 day SMA | 15.53 | 15.55 | 15.58 | | 50 day SMA | 15.46 | 15.46 | 15.46 | | 100 day SMA | 15.62 | 15.63 | 15.63 | | 150 day SMA | 15.94 | 15.96 | 15.97 | | 200 day SMA | 17.34 | 17.38 | 17.42 |
|
|
