QualysInc QLYS full analysis,charts,indicators,moving averages,SMA,DMA,EMA,ADX,MACD,RSIQualys Inc QLYS WideScreen charts, DMA,SMA,EMA technical analysis, forecast prediction, by indicators ADX,MACD,RSI,CCI USA stock exchange
operates under Technology sector & deals in Computer Software Prepackaged Software
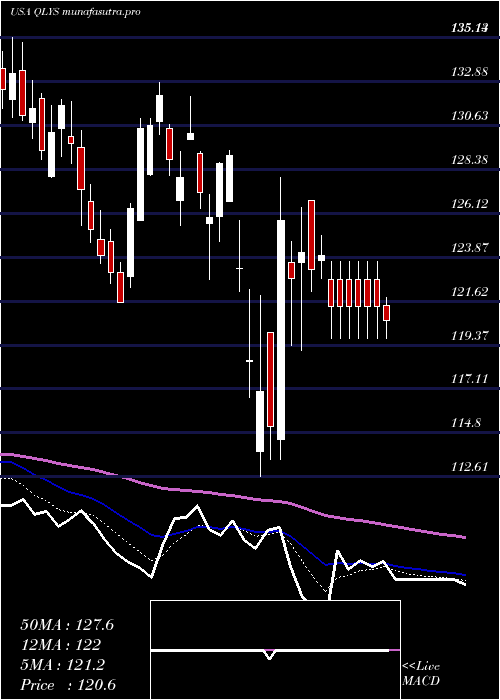
Daily price and charts and targets QualysInc Strong Daily Stock price targets for QualysInc QLYS are 148.04 and 150.59 | Daily Target 1 | 147.51 | | Daily Target 2 | 148.57 | | Daily Target 3 | 150.06 | | Daily Target 4 | 151.12 | | Daily Target 5 | 152.61 |
Daily price and volume Qualys Inc
| Date |
Closing |
Open |
Range |
Volume |
Thu 04 December 2025 |
149.63 (0.34%) |
150.00 |
149.00 - 151.55 |
0.9879 times |
Wed 03 December 2025 |
149.13 (2.28%) |
145.00 |
144.24 - 149.92 |
1.0281 times |
Tue 02 December 2025 |
145.81 (1.85%) |
144.63 |
144.29 - 148.49 |
1.2903 times |
Mon 01 December 2025 |
143.16 (1.64%) |
141.40 |
140.60 - 144.67 |
0.9808 times |
Fri 28 November 2025 |
140.85 (-0.55%) |
141.42 |
140.67 - 143.00 |
0.4633 times |
Wed 26 November 2025 |
141.63 (-0.11%) |
141.09 |
139.89 - 143.00 |
0.7364 times |
Tue 25 November 2025 |
141.79 (0.9%) |
141.70 |
139.72 - 143.30 |
0.8216 times |
Mon 24 November 2025 |
140.52 (-1.78%) |
143.39 |
139.24 - 143.39 |
0.9876 times |
Fri 21 November 2025 |
143.07 (3.75%) |
138.05 |
136.27 - 144.47 |
1.8978 times |
Thu 20 November 2025 |
137.90 (-0.22%) |
139.85 |
137.29 - 140.71 |
0.8062 times |
Wed 19 November 2025 |
138.21 (-0.25%) |
137.85 |
136.17 - 139.06 |
0.7444 times |
Weekly price and charts QualysInc Strong weekly Stock price targets for QualysInc QLYS are 145.12 and 156.07 | Weekly Target 1 | 136.31 | | Weekly Target 2 | 142.97 | | Weekly Target 3 | 147.26 | | Weekly Target 4 | 153.92 | | Weekly Target 5 | 158.21 |
Weekly price and volumes for Qualys Inc
| Date |
Closing |
Open |
Range |
Volume |
Thu 04 December 2025 |
149.63 (6.23%) |
141.40 |
140.60 - 151.55 |
0.8873 times |
Fri 28 November 2025 |
140.85 (-1.55%) |
143.39 |
139.24 - 143.39 |
0.6228 times |
Fri 21 November 2025 |
143.07 (-0.35%) |
143.67 |
136.17 - 144.59 |
1.1027 times |
Fri 14 November 2025 |
143.57 (-4.11%) |
150.27 |
140.58 - 155.47 |
1.2961 times |
Fri 07 November 2025 |
149.73 (21.47%) |
124.14 |
121.01 - 151.65 |
2.2006 times |
Fri 31 October 2025 |
123.26 (0%) |
122.63 |
121.92 - 124.19 |
0.1784 times |
Fri 31 October 2025 |
123.26 (-3.74%) |
128.68 |
121.92 - 129.05 |
0.9166 times |
Fri 24 October 2025 |
128.05 (1.15%) |
127.23 |
126.44 - 132.72 |
0.7424 times |
Fri 17 October 2025 |
126.60 (-1.72%) |
130.42 |
125.30 - 130.59 |
1.0169 times |
Fri 10 October 2025 |
128.81 (-1.72%) |
131.71 |
126.47 - 132.26 |
1.0363 times |
Fri 03 October 2025 |
131.07 (-4.09%) |
137.31 |
129.88 - 137.48 |
0.9315 times |
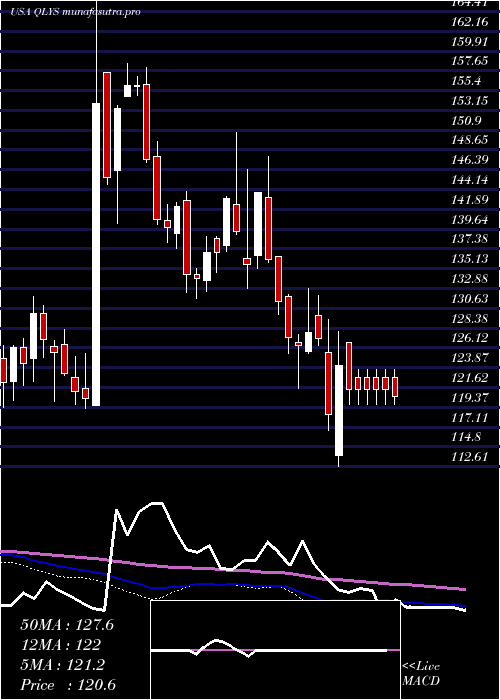
Monthly price and charts QualysInc Strong monthly Stock price targets for QualysInc QLYS are 145.12 and 156.07 | Monthly Target 1 | 136.31 | | Monthly Target 2 | 142.97 | | Monthly Target 3 | 147.26 | | Monthly Target 4 | 153.92 | | Monthly Target 5 | 158.21 |
Monthly price and volumes Qualys Inc
| Date |
Closing |
Open |
Range |
Volume |
Thu 04 December 2025 |
149.63 (6.23%) |
141.40 |
140.60 - 151.55 |
0.2361 times |
Fri 28 November 2025 |
140.85 (14.27%) |
124.14 |
121.01 - 155.47 |
1.3893 times |
Fri 31 October 2025 |
123.26 (-6.85%) |
131.81 |
121.92 - 133.90 |
1.192 times |
Tue 30 September 2025 |
132.33 (-2.56%) |
133.00 |
131.00 - 137.48 |
1.0164 times |
Fri 29 August 2025 |
135.81 (2.06%) |
132.50 |
124.10 - 137.27 |
1.1481 times |
Thu 31 July 2025 |
133.07 (-6.86%) |
142.84 |
132.89 - 151.10 |
0.9933 times |
Mon 30 June 2025 |
142.87 (3.12%) |
138.59 |
134.87 - 143.16 |
0.9237 times |
Fri 30 May 2025 |
138.55 (10.21%) |
126.93 |
122.10 - 139.01 |
1.1261 times |
Wed 30 April 2025 |
125.71 (-0.17%) |
125.97 |
112.61 - 129.34 |
1.1003 times |
Mon 31 March 2025 |
125.93 (-4.21%) |
132.00 |
121.53 - 132.83 |
0.8749 times |
Fri 28 February 2025 |
131.46 (-5.7%) |
136.26 |
129.94 - 147.86 |
1.0707 times |

DMA SMA EMA moving averages of Qualys Inc QLYS
DMA (daily moving average) of Qualys Inc QLYS
| DMA period | DMA value | | 5 day DMA | 145.72 | | 12 day DMA | 142.52 | | 20 day DMA | 144.46 | | 35 day DMA | 137.15 | | 50 day DMA | 135.25 | | 100 day DMA | 134.66 | | 150 day DMA | 135.88 | | 200 day DMA | 133.46 | EMA (exponential moving average) of Qualys Inc QLYS
| EMA period | EMA current | EMA prev | EMA prev2 | | 5 day EMA | 146.64 | 145.14 | 143.14 | | 12 day EMA | 144.05 | 143.04 | 141.93 | | 20 day EMA | 142.15 | 141.36 | 140.54 | | 35 day EMA | 139.71 | 139.13 | 138.54 | | 50 day EMA | 136.37 | 135.83 | 135.29 |
SMA (simple moving average) of Qualys Inc QLYS
| SMA period | SMA current | SMA prev | SMA prev2 | | 5 day SMA | 145.72 | 144.12 | 142.65 | | 12 day SMA | 142.52 | 141.67 | 141.21 | | 20 day SMA | 144.46 | 144.28 | 142.89 | | 35 day SMA | 137.15 | 136.52 | 135.91 | | 50 day SMA | 135.25 | 134.98 | 134.7 | | 100 day SMA | 134.66 | 134.54 | 134.44 | | 150 day SMA | 135.88 | 135.72 | 135.58 | | 200 day SMA | 133.46 | 133.44 | 133.43 |
|
|
