QuantaServices PWR full analysis,charts,indicators,moving averages,SMA,DMA,EMA,ADX,MACD,RSIQuanta Services PWR WideScreen charts, DMA,SMA,EMA technical analysis, forecast prediction, by indicators ADX,MACD,RSI,CCI USA stock exchange
operates under Capital Goods sector & deals in Engineering Construction
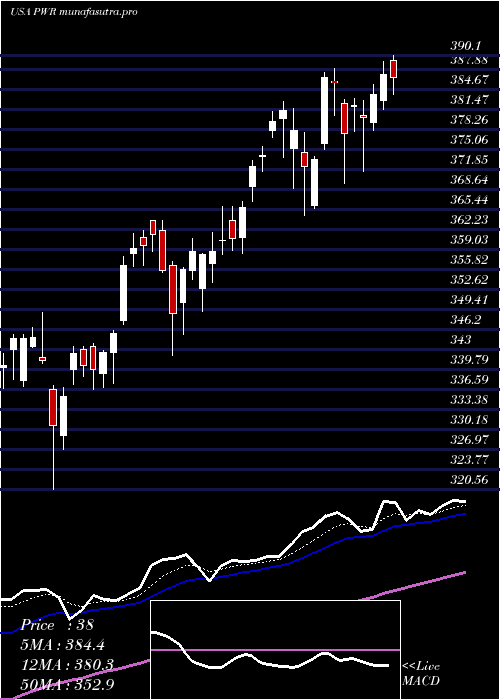
Daily price and charts and targets QuantaServices Strong Daily Stock price targets for QuantaServices PWR are 421.47 and 439.27 | Daily Target 1 | 416.14 | | Daily Target 2 | 426.79 | | Daily Target 3 | 433.94333333333 | | Daily Target 4 | 444.59 | | Daily Target 5 | 451.74 |
Daily price and volume Quanta Services
| Date |
Closing |
Open |
Range |
Volume |
Tue 21 October 2025 |
437.43 (-0.75%) |
437.52 |
423.30 - 441.10 |
0.8807 times |
Mon 20 October 2025 |
440.74 (1.59%) |
437.16 |
437.16 - 444.06 |
0.6665 times |
Fri 17 October 2025 |
433.85 (-0.84%) |
435.94 |
430.00 - 440.68 |
0.6784 times |
Thu 16 October 2025 |
437.52 (0.14%) |
440.41 |
434.21 - 446.60 |
0.8927 times |
Wed 15 October 2025 |
436.93 (1.23%) |
437.00 |
432.00 - 442.32 |
0.7424 times |
Tue 14 October 2025 |
431.60 (0.14%) |
423.81 |
420.56 - 438.93 |
0.8529 times |
Mon 13 October 2025 |
430.98 (3.2%) |
426.17 |
425.00 - 434.95 |
0.7431 times |
Fri 10 October 2025 |
417.61 (-2.86%) |
432.75 |
416.51 - 437.07 |
2.1348 times |
Thu 09 October 2025 |
429.92 (-3.05%) |
443.00 |
427.30 - 443.45 |
1.2232 times |
Wed 08 October 2025 |
443.45 (5.21%) |
423.19 |
421.43 - 443.97 |
1.1853 times |
Tue 07 October 2025 |
421.51 (-1.47%) |
429.00 |
415.21 - 434.39 |
0.8882 times |
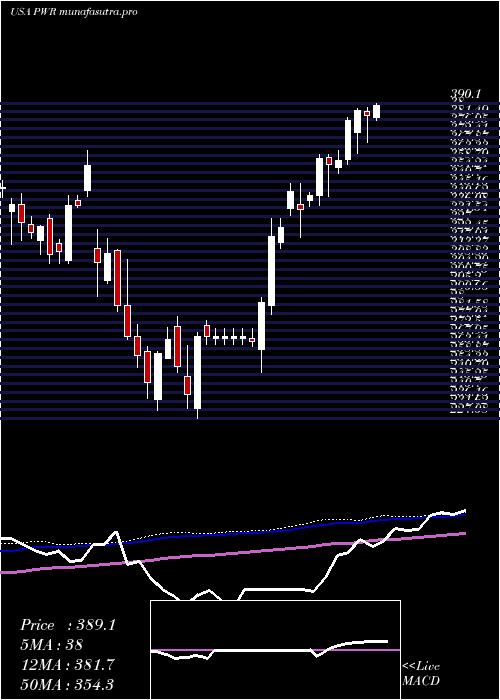
Weekly price and charts QuantaServices Strong weekly Stock price targets for QuantaServices PWR are 430.37 and 451.13 | Weekly Target 1 | 414.17 | | Weekly Target 2 | 425.8 | | Weekly Target 3 | 434.93 | | Weekly Target 4 | 446.56 | | Weekly Target 5 | 455.69 |
Weekly price and volumes for Quanta Services
| Date |
Closing |
Open |
Range |
Volume |
Tue 21 October 2025 |
437.43 (0.83%) |
437.16 |
423.30 - 444.06 |
0.4225 times |
Fri 17 October 2025 |
433.85 (3.89%) |
426.17 |
420.56 - 446.60 |
1.0676 times |
Fri 10 October 2025 |
417.61 (-0.85%) |
428.42 |
415.21 - 443.97 |
1.5789 times |
Fri 03 October 2025 |
421.17 (3.88%) |
405.88 |
405.88 - 431.24 |
0.9938 times |
Fri 26 September 2025 |
405.44 (4.34%) |
384.50 |
382.24 - 408.74 |
1.3328 times |
Fri 19 September 2025 |
388.58 (1.58%) |
382.90 |
373.40 - 393.42 |
1.3367 times |
Fri 12 September 2025 |
382.53 (2.69%) |
377.01 |
370.27 - 400.87 |
1.1967 times |
Fri 05 September 2025 |
372.50 (-1.44%) |
370.00 |
363.01 - 379.09 |
0.9129 times |
Fri 29 August 2025 |
377.96 (0%) |
385.76 |
373.47 - 385.76 |
0.201 times |
Fri 29 August 2025 |
377.96 (-0.49%) |
379.84 |
373.47 - 387.81 |
0.957 times |
Fri 22 August 2025 |
379.84 (-0.25%) |
379.75 |
367.90 - 386.29 |
1.1228 times |
Monthly price and charts QuantaServices Strong monthly Stock price targets for QuantaServices PWR are 422.37 and 461.66 | Monthly Target 1 | 391.16 | | Monthly Target 2 | 414.29 | | Monthly Target 3 | 430.44666666667 | | Monthly Target 4 | 453.58 | | Monthly Target 5 | 469.74 |
Monthly price and volumes Quanta Services
| Date |
Closing |
Open |
Range |
Volume |
Tue 21 October 2025 |
437.43 (5.55%) |
410.76 |
407.31 - 446.60 |
0.5328 times |
Tue 30 September 2025 |
414.42 (9.65%) |
370.00 |
363.01 - 415.36 |
0.7801 times |
Fri 29 August 2025 |
377.96 (-6.94%) |
392.60 |
367.90 - 400.09 |
0.7846 times |
Thu 31 July 2025 |
406.13 (7.42%) |
374.59 |
364.44 - 424.94 |
0.994 times |
Mon 30 June 2025 |
378.08 (10.37%) |
342.49 |
337.48 - 382.79 |
0.8478 times |
Fri 30 May 2025 |
342.56 (17.04%) |
320.21 |
312.30 - 348.90 |
1.0575 times |
Wed 30 April 2025 |
292.69 (15.15%) |
252.85 |
227.08 - 294.25 |
1.0333 times |
Mon 31 March 2025 |
254.18 (-2.1%) |
261.66 |
231.31 - 279.75 |
1.2869 times |
Fri 28 February 2025 |
259.63 (-15.6%) |
298.31 |
253.44 - 320.41 |
1.4408 times |
Fri 31 January 2025 |
307.61 (-2.67%) |
318.54 |
290.43 - 365.88 |
1.2422 times |
Tue 31 December 2024 |
316.05 (-8.81%) |
333.93 |
313.82 - 343.44 |
0.6273 times |
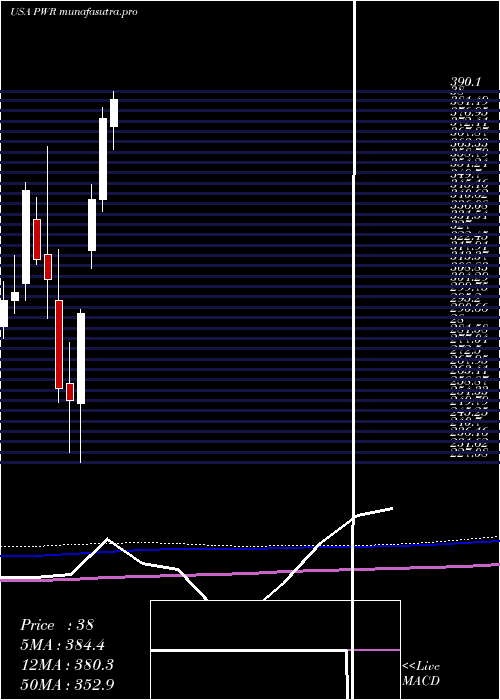
DMA SMA EMA moving averages of Quanta Services PWR
DMA (daily moving average) of Quanta Services PWR
| DMA period | DMA value | | 5 day DMA | 437.29 | | 12 day DMA | 432.45 | | 20 day DMA | 424.21 | | 35 day DMA | 406.38 | | 50 day DMA | 398.37 | | 100 day DMA | 388.85 | | 150 day DMA | 356.76 | | 200 day DMA | 340.47 | EMA (exponential moving average) of Quanta Services PWR
| EMA period | EMA current | EMA prev | EMA prev2 | | 5 day EMA | 436.44 | 435.95 | 433.56 | | 12 day EMA | 430.85 | 429.65 | 427.63 | | 20 day EMA | 423.7 | 422.25 | 420.31 | | 35 day EMA | 413.13 | 411.7 | 409.99 | | 50 day EMA | 401.33 | 399.86 | 398.19 |
SMA (simple moving average) of Quanta Services PWR
| SMA period | SMA current | SMA prev | SMA prev2 | | 5 day SMA | 437.29 | 436.13 | 434.18 | | 12 day SMA | 432.45 | 431.09 | 429.43 | | 20 day SMA | 424.21 | 421.82 | 419.58 | | 35 day SMA | 406.38 | 404.59 | 402.79 | | 50 day SMA | 398.37 | 397.45 | 396.32 | | 100 day SMA | 388.85 | 387.88 | 386.89 | | 150 day SMA | 356.76 | 355.64 | 354.46 | | 200 day SMA | 340.47 | 339.88 | 339.32 |
|
|
