ProvidentBancorp PVBC full analysis,charts,indicators,moving averages,SMA,DMA,EMA,ADX,MACD,RSIProvident Bancorp PVBC WideScreen charts, DMA,SMA,EMA technical analysis, forecast prediction, by indicators ADX,MACD,RSI,CCI USA stock exchange
operates under Finance sector & deals in Savings Institutions
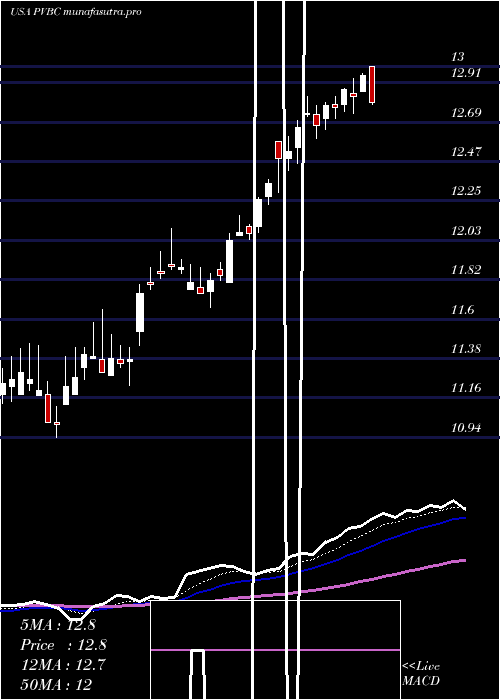
Daily price and charts and targets ProvidentBancorp Strong Daily Stock price targets for ProvidentBancorp PVBC are 12.51 and 12.79 | Daily Target 1 | 12.27 | | Daily Target 2 | 12.46 | | Daily Target 3 | 12.553333333333 | | Daily Target 4 | 12.74 | | Daily Target 5 | 12.83 |
Daily price and volume Provident Bancorp
| Date |
Closing |
Open |
Range |
Volume |
Mon 20 October 2025 |
12.64 (1.53%) |
12.41 |
12.37 - 12.65 |
0.7313 times |
Fri 17 October 2025 |
12.45 (0.57%) |
12.37 |
12.31 - 12.46 |
0.8151 times |
Thu 16 October 2025 |
12.38 (-1.12%) |
12.51 |
12.30 - 12.62 |
1.1388 times |
Wed 15 October 2025 |
12.52 (-0.71%) |
12.63 |
12.44 - 12.63 |
0.3982 times |
Tue 14 October 2025 |
12.61 (1.53%) |
12.32 |
12.32 - 12.63 |
0.5845 times |
Mon 13 October 2025 |
12.42 (0.98%) |
12.34 |
12.30 - 12.43 |
0.5519 times |
Fri 10 October 2025 |
12.30 (-1.28%) |
12.44 |
12.30 - 12.50 |
0.8361 times |
Thu 09 October 2025 |
12.46 (-0.4%) |
12.47 |
12.42 - 12.50 |
0.4122 times |
Wed 08 October 2025 |
12.51 (-0.24%) |
12.59 |
12.50 - 12.63 |
3.8472 times |
Tue 07 October 2025 |
12.54 (-0.63%) |
12.55 |
12.53 - 12.66 |
0.6847 times |
Mon 06 October 2025 |
12.62 (1.04%) |
12.54 |
12.53 - 12.64 |
0.6451 times |
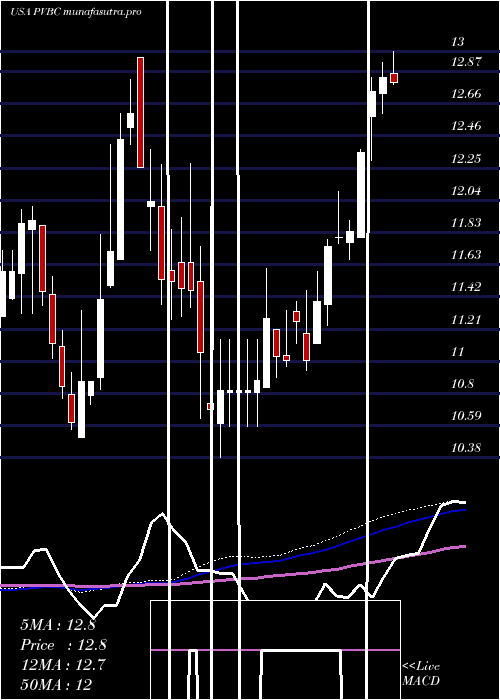
Weekly price and charts ProvidentBancorp Strong weekly Stock price targets for ProvidentBancorp PVBC are 12.51 and 12.79 | Weekly Target 1 | 12.27 | | Weekly Target 2 | 12.46 | | Weekly Target 3 | 12.553333333333 | | Weekly Target 4 | 12.74 | | Weekly Target 5 | 12.83 |
Weekly price and volumes for Provident Bancorp
| Date |
Closing |
Open |
Range |
Volume |
Mon 20 October 2025 |
12.64 (1.53%) |
12.41 |
12.37 - 12.65 |
0.2262 times |
Fri 17 October 2025 |
12.45 (1.22%) |
12.34 |
12.30 - 12.63 |
1.0792 times |
Fri 10 October 2025 |
12.30 (-1.52%) |
12.54 |
12.30 - 12.66 |
1.9876 times |
Fri 03 October 2025 |
12.49 (-1.58%) |
12.68 |
12.36 - 12.68 |
1.0533 times |
Fri 26 September 2025 |
12.69 (-0.7%) |
12.75 |
12.59 - 12.82 |
0.5562 times |
Fri 19 September 2025 |
12.78 (0.55%) |
12.70 |
12.65 - 13.02 |
2.1439 times |
Fri 12 September 2025 |
12.71 (-1.09%) |
12.90 |
12.68 - 12.90 |
0.8263 times |
Fri 05 September 2025 |
12.85 (-0.16%) |
12.97 |
12.77 - 13.01 |
0.729 times |
Fri 29 August 2025 |
12.87 (0%) |
12.94 |
12.85 - 12.98 |
0.2795 times |
Fri 29 August 2025 |
12.87 (0%) |
12.82 |
12.77 - 12.99 |
1.1188 times |
Fri 22 August 2025 |
12.87 (2.96%) |
12.46 |
12.39 - 12.90 |
1.1332 times |
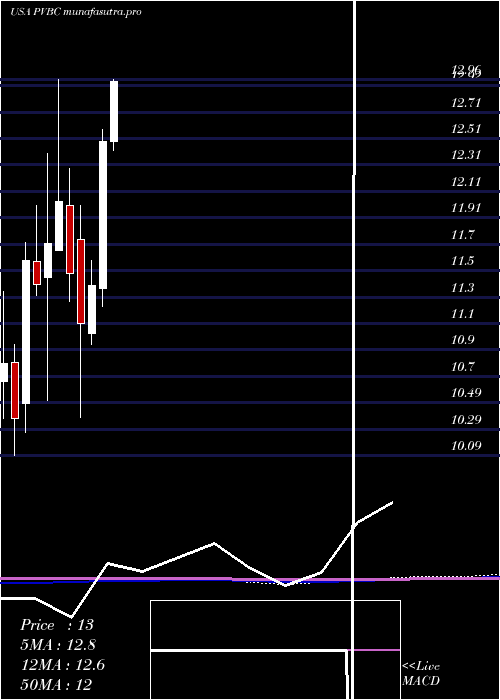
Monthly price and charts ProvidentBancorp Strong monthly Stock price targets for ProvidentBancorp PVBC are 12.47 and 12.83 | Monthly Target 1 | 12.17 | | Monthly Target 2 | 12.41 | | Monthly Target 3 | 12.533333333333 | | Monthly Target 4 | 12.77 | | Monthly Target 5 | 12.89 |
Monthly price and volumes Provident Bancorp
| Date |
Closing |
Open |
Range |
Volume |
Mon 20 October 2025 |
12.64 (0.88%) |
12.45 |
12.30 - 12.66 |
0.3634 times |
Tue 30 September 2025 |
12.53 (-2.64%) |
12.97 |
12.39 - 13.02 |
0.4485 times |
Fri 29 August 2025 |
12.87 (5.41%) |
12.15 |
12.00 - 12.99 |
0.6486 times |
Thu 31 July 2025 |
12.21 (-2.24%) |
12.49 |
12.20 - 13.02 |
1.5143 times |
Mon 30 June 2025 |
12.49 (9.66%) |
11.37 |
11.23 - 12.58 |
5.2663 times |
Fri 30 May 2025 |
11.39 (2.61%) |
11.02 |
10.94 - 11.58 |
0.4352 times |
Wed 30 April 2025 |
11.10 (-3.31%) |
11.74 |
10.38 - 12.00 |
0.3283 times |
Mon 31 March 2025 |
11.48 (-4.57%) |
12.00 |
11.27 - 12.28 |
0.2746 times |
Fri 28 February 2025 |
12.03 (2.73%) |
11.66 |
11.66 - 12.96 |
0.3632 times |
Fri 31 January 2025 |
11.71 (2.72%) |
11.45 |
10.51 - 12.40 |
0.3576 times |
Tue 31 December 2024 |
11.40 (-1.55%) |
11.57 |
11.31 - 12.00 |
0.3508 times |
DMA SMA EMA moving averages of Provident Bancorp PVBC
DMA (daily moving average) of Provident Bancorp PVBC
| DMA period | DMA value | | 5 day DMA | 12.52 | | 12 day DMA | 12.5 | | 20 day DMA | 12.53 | | 35 day DMA | 12.65 | | 50 day DMA | 12.67 | | 100 day DMA | 12.44 | | 150 day DMA | 12.02 | | 200 day DMA | 11.93 | EMA (exponential moving average) of Provident Bancorp PVBC
| EMA period | EMA current | EMA prev | EMA prev2 | | 5 day EMA | 12.52 | 12.46 | 12.46 | | 12 day EMA | 12.51 | 12.49 | 12.5 | | 20 day EMA | 12.54 | 12.53 | 12.54 | | 35 day EMA | 12.56 | 12.56 | 12.57 | | 50 day EMA | 12.62 | 12.62 | 12.63 |
SMA (simple moving average) of Provident Bancorp PVBC
| SMA period | SMA current | SMA prev | SMA prev2 | | 5 day SMA | 12.52 | 12.48 | 12.45 | | 12 day SMA | 12.5 | 12.48 | 12.48 | | 20 day SMA | 12.53 | 12.54 | 12.55 | | 35 day SMA | 12.65 | 12.65 | 12.67 | | 50 day SMA | 12.67 | 12.67 | 12.66 | | 100 day SMA | 12.44 | 12.43 | 12.41 | | 150 day SMA | 12.02 | 12.01 | 12 | | 200 day SMA | 11.93 | 11.93 | 11.92 |
|
|
