PulmatrixInc PULM full analysis,charts,indicators,moving averages,SMA,DMA,EMA,ADX,MACD,RSIPulmatrix Inc PULM WideScreen charts, DMA,SMA,EMA technical analysis, forecast prediction, by indicators ADX,MACD,RSI,CCI USA stock exchange
operates under Health Care sector & deals in Major Pharmaceuticals
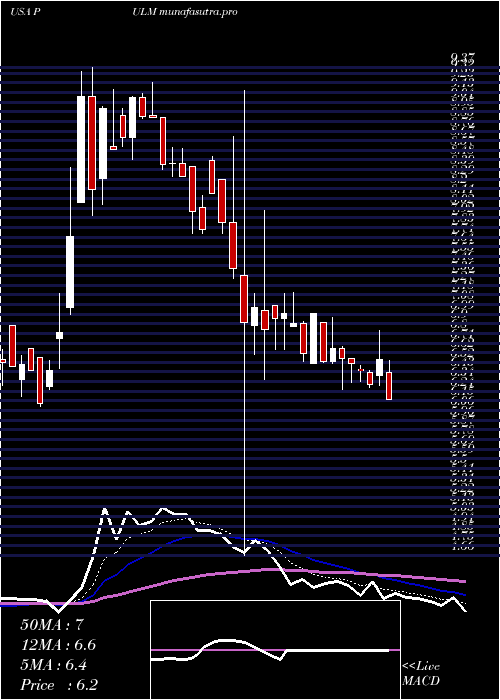
Daily price and charts and targets PulmatrixInc Strong Daily Stock price targets for PulmatrixInc PULM are 4.18 and 4.35 | Daily Target 1 | 4.15 | | Daily Target 2 | 4.21 | | Daily Target 3 | 4.32 | | Daily Target 4 | 4.38 | | Daily Target 5 | 4.49 |
Daily price and volume Pulmatrix Inc
| Date |
Closing |
Open |
Range |
Volume |
Thu 04 December 2025 |
4.27 (-3.61%) |
4.39 |
4.26 - 4.43 |
0.7458 times |
Wed 03 December 2025 |
4.43 (0%) |
4.31 |
4.30 - 4.45 |
0.9628 times |
Tue 02 December 2025 |
4.43 (-3.06%) |
4.45 |
4.34 - 4.58 |
0.6645 times |
Mon 01 December 2025 |
4.57 (2.7%) |
4.36 |
4.36 - 4.67 |
1.1526 times |
Fri 28 November 2025 |
4.45 (-0.89%) |
4.61 |
4.37 - 4.61 |
1.1526 times |
Wed 26 November 2025 |
4.49 (3.94%) |
4.61 |
4.44 - 4.80 |
2.0205 times |
Tue 25 November 2025 |
4.32 (-4%) |
4.50 |
4.32 - 4.50 |
0.9357 times |
Mon 24 November 2025 |
4.50 (-4.26%) |
4.50 |
4.41 - 4.58 |
0.9085 times |
Fri 21 November 2025 |
4.70 (0.64%) |
4.56 |
4.36 - 4.72 |
0.5214 times |
Thu 20 November 2025 |
4.67 (6.62%) |
4.31 |
4.26 - 4.85 |
0.9357 times |
Wed 19 November 2025 |
4.38 (-2.67%) |
4.65 |
4.38 - 4.65 |
0.6916 times |
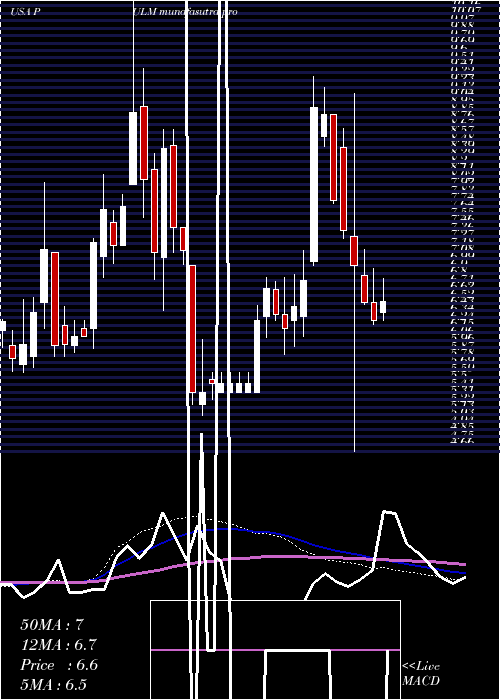
Weekly price and charts PulmatrixInc Strong weekly Stock price targets for PulmatrixInc PULM are 4.06 and 4.47 | Weekly Target 1 | 3.99 | | Weekly Target 2 | 4.13 | | Weekly Target 3 | 4.4 | | Weekly Target 4 | 4.54 | | Weekly Target 5 | 4.81 |
Weekly price and volumes for Pulmatrix Inc
| Date |
Closing |
Open |
Range |
Volume |
Thu 04 December 2025 |
4.27 (-4.04%) |
4.36 |
4.26 - 4.67 |
0.571 times |
Fri 28 November 2025 |
4.45 (-5.32%) |
4.50 |
4.32 - 4.80 |
0.8125 times |
Fri 21 November 2025 |
4.70 (-0.21%) |
4.74 |
4.26 - 4.98 |
0.5368 times |
Fri 14 November 2025 |
4.71 (-2.89%) |
4.80 |
4.61 - 4.97 |
0.2767 times |
Fri 07 November 2025 |
4.85 (-1.62%) |
4.85 |
4.59 - 4.99 |
0.4458 times |
Fri 31 October 2025 |
4.93 (0%) |
4.90 |
4.83 - 4.98 |
0.1471 times |
Fri 31 October 2025 |
4.93 (1.86%) |
4.84 |
4.81 - 4.98 |
0.4765 times |
Fri 24 October 2025 |
4.84 (0.62%) |
4.80 |
4.50 - 5.24 |
1.0324 times |
Fri 17 October 2025 |
4.81 (0.84%) |
4.99 |
4.58 - 5.00 |
1.7744 times |
Fri 10 October 2025 |
4.77 (-2.05%) |
4.90 |
4.35 - 5.50 |
3.9267 times |
Fri 03 October 2025 |
4.87 (9.93%) |
4.50 |
4.50 - 4.98 |
0.676 times |
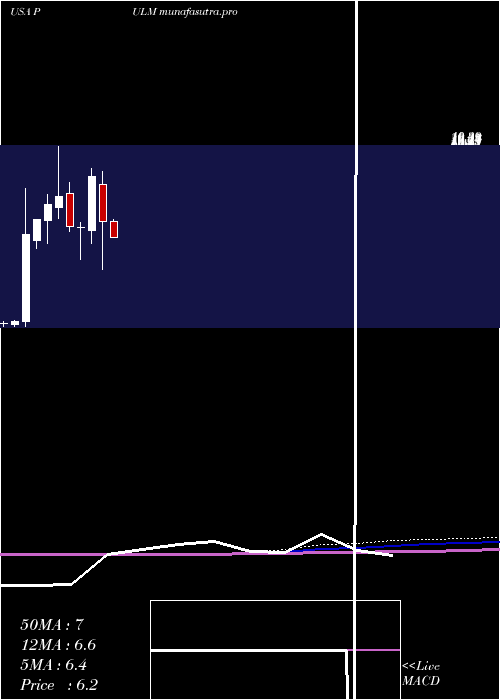
Monthly price and charts PulmatrixInc Strong monthly Stock price targets for PulmatrixInc PULM are 4.06 and 4.47 | Monthly Target 1 | 3.99 | | Monthly Target 2 | 4.13 | | Monthly Target 3 | 4.4 | | Monthly Target 4 | 4.54 | | Monthly Target 5 | 4.81 |
Monthly price and volumes Pulmatrix Inc
| Date |
Closing |
Open |
Range |
Volume |
Thu 04 December 2025 |
4.27 (-4.04%) |
4.36 |
4.26 - 4.67 |
0.0728 times |
Fri 28 November 2025 |
4.45 (-9.74%) |
4.85 |
4.26 - 4.99 |
0.2643 times |
Fri 31 October 2025 |
4.93 (1.44%) |
4.85 |
4.35 - 5.50 |
0.9924 times |
Tue 30 September 2025 |
4.86 (-1.42%) |
4.89 |
4.33 - 5.19 |
0.6657 times |
Fri 29 August 2025 |
4.93 (-12.43%) |
5.45 |
4.44 - 5.58 |
0.694 times |
Thu 31 July 2025 |
5.63 (-18.41%) |
6.90 |
5.20 - 7.00 |
0.6603 times |
Mon 30 June 2025 |
6.90 (-23.16%) |
8.61 |
4.66 - 9.23 |
3.467 times |
Fri 30 May 2025 |
8.98 (35.85%) |
6.49 |
5.88 - 9.37 |
1.1754 times |
Wed 30 April 2025 |
6.61 (-0.75%) |
6.60 |
5.12 - 6.84 |
0.872 times |
Mon 31 March 2025 |
6.66 (-17.57%) |
8.20 |
6.43 - 8.70 |
1.1359 times |
Fri 28 February 2025 |
8.08 (4.94%) |
7.53 |
7.02 - 10.40 |
2.0238 times |
DMA SMA EMA moving averages of Pulmatrix Inc PULM
DMA (daily moving average) of Pulmatrix Inc PULM
| DMA period | DMA value | | 5 day DMA | 4.43 | | 12 day DMA | 4.48 | | 20 day DMA | 4.61 | | 35 day DMA | 4.72 | | 50 day DMA | 4.74 | | 100 day DMA | 4.93 | | 150 day DMA | 5.67 | | 200 day DMA | 5.95 | EMA (exponential moving average) of Pulmatrix Inc PULM
| EMA period | EMA current | EMA prev | EMA prev2 | | 5 day EMA | 4.4 | 4.46 | 4.48 | | 12 day EMA | 4.5 | 4.54 | 4.56 | | 20 day EMA | 4.56 | 4.59 | 4.61 | | 35 day EMA | 4.65 | 4.67 | 4.68 | | 50 day EMA | 4.71 | 4.73 | 4.74 |
SMA (simple moving average) of Pulmatrix Inc PULM
| SMA period | SMA current | SMA prev | SMA prev2 | | 5 day SMA | 4.43 | 4.47 | 4.45 | | 12 day SMA | 4.48 | 4.52 | 4.54 | | 20 day SMA | 4.61 | 4.64 | 4.66 | | 35 day SMA | 4.72 | 4.74 | 4.75 | | 50 day SMA | 4.74 | 4.75 | 4.75 | | 100 day SMA | 4.93 | 4.95 | 4.97 | | 150 day SMA | 5.67 | 5.69 | 5.7 | | 200 day SMA | 5.95 | 5.98 | 6.01 |
|
|
