PattersonUti PTEN full analysis,charts,indicators,moving averages,SMA,DMA,EMA,ADX,MACD,RSIPatterson Uti PTEN WideScreen charts, DMA,SMA,EMA technical analysis, forecast prediction, by indicators ADX,MACD,RSI,CCI USA stock exchange
operates under Energy sector & deals in Oil Gas Production
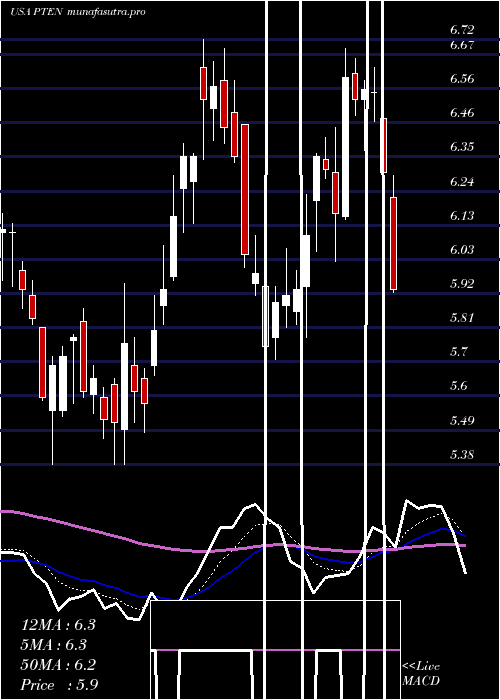
Daily price and charts and targets PattersonUti Strong Daily Stock price targets for PattersonUti PTEN are 5.64 and 5.92 | Daily Target 1 | 5.41 | | Daily Target 2 | 5.59 | | Daily Target 3 | 5.69 | | Daily Target 4 | 5.87 | | Daily Target 5 | 5.97 |
Daily price and volume Patterson Uti
| Date |
Closing |
Open |
Range |
Volume |
Mon 20 October 2025 |
5.77 (2.3%) |
5.54 |
5.51 - 5.79 |
0.891 times |
Fri 17 October 2025 |
5.64 (0.36%) |
5.48 |
5.45 - 5.67 |
1.0192 times |
Thu 16 October 2025 |
5.62 (-1.92%) |
5.79 |
5.49 - 5.83 |
0.8124 times |
Wed 15 October 2025 |
5.73 (0.88%) |
5.74 |
5.64 - 5.87 |
0.836 times |
Tue 14 October 2025 |
5.68 (0.18%) |
5.50 |
5.47 - 5.72 |
0.8658 times |
Mon 13 October 2025 |
5.67 (5.59%) |
5.42 |
5.36 - 5.68 |
1.1796 times |
Fri 10 October 2025 |
5.37 (-5.95%) |
5.70 |
5.34 - 5.76 |
1.5037 times |
Thu 09 October 2025 |
5.71 (-3.22%) |
5.88 |
5.68 - 6.01 |
0.7253 times |
Wed 08 October 2025 |
5.90 (-0.51%) |
5.95 |
5.85 - 6.04 |
0.9293 times |
Tue 07 October 2025 |
5.93 (2.07%) |
5.84 |
5.72 - 5.94 |
1.2377 times |
Mon 06 October 2025 |
5.81 (4.5%) |
5.61 |
5.59 - 5.93 |
1.4875 times |
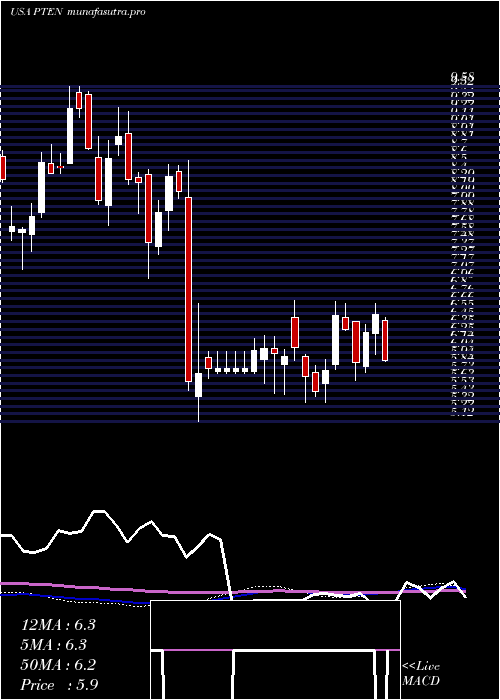
Weekly price and charts PattersonUti Strong weekly Stock price targets for PattersonUti PTEN are 5.64 and 5.92 | Weekly Target 1 | 5.41 | | Weekly Target 2 | 5.59 | | Weekly Target 3 | 5.69 | | Weekly Target 4 | 5.87 | | Weekly Target 5 | 5.97 |
Weekly price and volumes for Patterson Uti
| Date |
Closing |
Open |
Range |
Volume |
Mon 20 October 2025 |
5.77 (2.3%) |
5.54 |
5.51 - 5.79 |
0.1981 times |
Fri 17 October 2025 |
5.64 (5.03%) |
5.42 |
5.36 - 5.87 |
1.0477 times |
Fri 10 October 2025 |
5.37 (-3.42%) |
5.61 |
5.34 - 6.04 |
1.3079 times |
Fri 03 October 2025 |
5.56 (-0.36%) |
5.54 |
5.10 - 5.64 |
1.4376 times |
Fri 26 September 2025 |
5.58 (4.3%) |
5.30 |
5.24 - 5.75 |
1.0981 times |
Fri 19 September 2025 |
5.35 (-3.43%) |
5.62 |
5.27 - 5.70 |
1.2861 times |
Fri 12 September 2025 |
5.54 (-2.29%) |
5.71 |
5.27 - 5.82 |
1.352 times |
Fri 05 September 2025 |
5.67 (-2.41%) |
5.68 |
5.41 - 5.86 |
0.9734 times |
Fri 29 August 2025 |
5.81 (0%) |
5.71 |
5.68 - 5.88 |
0.2125 times |
Fri 29 August 2025 |
5.81 (0%) |
5.81 |
5.63 - 5.88 |
1.0865 times |
Fri 22 August 2025 |
5.81 (7.99%) |
5.35 |
5.20 - 5.82 |
1.2417 times |
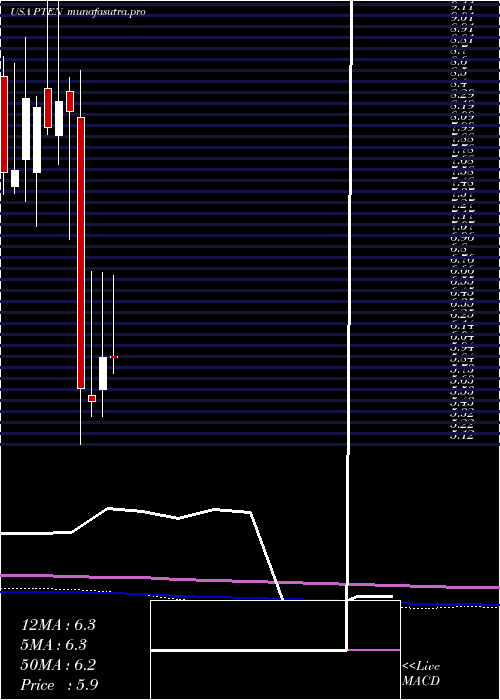
Monthly price and charts PattersonUti Strong monthly Stock price targets for PattersonUti PTEN are 5.46 and 6.35 | Monthly Target 1 | 4.76 | | Monthly Target 2 | 5.27 | | Monthly Target 3 | 5.6533333333333 | | Monthly Target 4 | 6.16 | | Monthly Target 5 | 6.54 |
Monthly price and volumes Patterson Uti
| Date |
Closing |
Open |
Range |
Volume |
Mon 20 October 2025 |
5.77 (11.39%) |
5.17 |
5.15 - 6.04 |
0.5386 times |
Tue 30 September 2025 |
5.18 (-10.84%) |
5.68 |
5.10 - 5.86 |
0.8234 times |
Fri 29 August 2025 |
5.81 (-1.69%) |
5.80 |
5.20 - 5.88 |
0.7697 times |
Thu 31 July 2025 |
5.91 (-0.34%) |
5.94 |
5.72 - 6.69 |
0.9613 times |
Mon 30 June 2025 |
5.93 (7.43%) |
5.63 |
5.38 - 6.72 |
1.2156 times |
Fri 30 May 2025 |
5.52 (-2.13%) |
5.57 |
5.38 - 6.73 |
1.3782 times |
Wed 30 April 2025 |
5.64 (-31.39%) |
8.16 |
5.12 - 8.60 |
1.3545 times |
Mon 31 March 2025 |
8.22 (-1.08%) |
8.41 |
7.03 - 8.54 |
1.1904 times |
Fri 28 February 2025 |
8.31 (2.97%) |
8.00 |
7.73 - 9.30 |
0.9075 times |
Fri 31 January 2025 |
8.07 (-2.3%) |
8.43 |
8.01 - 9.58 |
0.8607 times |
Tue 31 December 2024 |
8.26 (-0.96%) |
7.65 |
7.15 - 8.36 |
0.7521 times |
DMA SMA EMA moving averages of Patterson Uti PTEN
DMA (daily moving average) of Patterson Uti PTEN
| DMA period | DMA value | | 5 day DMA | 5.69 | | 12 day DMA | 5.7 | | 20 day DMA | 5.58 | | 35 day DMA | 5.57 | | 50 day DMA | 5.58 | | 100 day DMA | 5.79 | | 150 day DMA | 5.97 | | 200 day DMA | 6.58 | EMA (exponential moving average) of Patterson Uti PTEN
| EMA period | EMA current | EMA prev | EMA prev2 | | 5 day EMA | 5.69 | 5.65 | 5.66 | | 12 day EMA | 5.65 | 5.63 | 5.63 | | 20 day EMA | 5.61 | 5.59 | 5.59 | | 35 day EMA | 5.6 | 5.59 | 5.59 | | 50 day EMA | 5.58 | 5.57 | 5.57 |
SMA (simple moving average) of Patterson Uti PTEN
| SMA period | SMA current | SMA prev | SMA prev2 | | 5 day SMA | 5.69 | 5.67 | 5.61 | | 12 day SMA | 5.7 | 5.66 | 5.64 | | 20 day SMA | 5.58 | 5.56 | 5.55 | | 35 day SMA | 5.57 | 5.57 | 5.57 | | 50 day SMA | 5.58 | 5.57 | 5.57 | | 100 day SMA | 5.79 | 5.79 | 5.79 | | 150 day SMA | 5.97 | 5.98 | 6 | | 200 day SMA | 6.58 | 6.59 | 6.61 |
|
|
