PintecTechnology PT full analysis,charts,indicators,moving averages,SMA,DMA,EMA,ADX,MACD,RSIPintec Technology PT WideScreen charts, DMA,SMA,EMA technical analysis, forecast prediction, by indicators ADX,MACD,RSI,CCI USA stock exchange
operates under Technology sector & deals in Computer Software Programming Data Processing
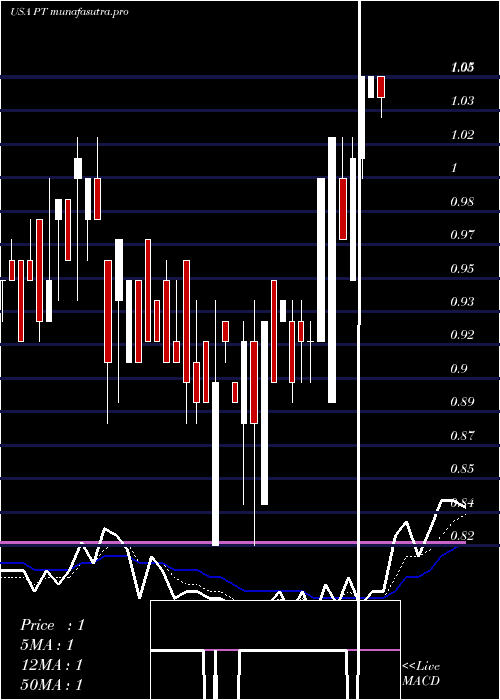
Daily price and charts and targets PintecTechnology Strong Daily Stock price targets for PintecTechnology PT are 0.99 and 1.05 | Daily Target 1 | 0.94 | | Daily Target 2 | 0.98 | | Daily Target 3 | 1.0033333333333 | | Daily Target 4 | 1.04 | | Daily Target 5 | 1.06 |
Daily price and volume Pintec Technology
| Date |
Closing |
Open |
Range |
Volume |
Thu 04 December 2025 |
1.01 (4.12%) |
0.98 |
0.97 - 1.03 |
0.7162 times |
Wed 03 December 2025 |
0.97 (0%) |
0.97 |
0.96 - 1.02 |
1.1222 times |
Tue 02 December 2025 |
0.97 (0%) |
0.98 |
0.96 - 1.00 |
1.1304 times |
Mon 01 December 2025 |
0.97 (-1.02%) |
0.95 |
0.95 - 1.03 |
0.859 times |
Fri 28 November 2025 |
0.98 (2.08%) |
0.99 |
0.96 - 1.01 |
0.6733 times |
Wed 26 November 2025 |
0.96 (0%) |
0.98 |
0.95 - 1.00 |
1.1814 times |
Tue 25 November 2025 |
0.96 (-4%) |
1.01 |
0.96 - 1.01 |
1.1977 times |
Mon 24 November 2025 |
1.00 (-2.91%) |
0.99 |
0.99 - 1.02 |
0.9182 times |
Fri 21 November 2025 |
1.03 (6.19%) |
0.94 |
0.92 - 1.03 |
1.2446 times |
Thu 20 November 2025 |
0.97 (-1.02%) |
0.94 |
0.94 - 1.01 |
0.9569 times |
Wed 19 November 2025 |
0.98 (2.08%) |
0.98 |
0.96 - 0.99 |
0.9835 times |
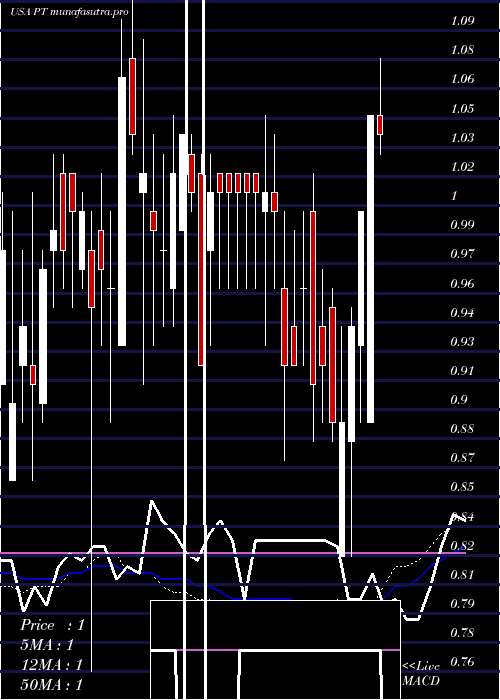
Weekly price and charts PintecTechnology Strong weekly Stock price targets for PintecTechnology PT are 0.98 and 1.06 | Weekly Target 1 | 0.92 | | Weekly Target 2 | 0.96 | | Weekly Target 3 | 0.99666666666667 | | Weekly Target 4 | 1.04 | | Weekly Target 5 | 1.08 |
Weekly price and volumes for Pintec Technology
| Date |
Closing |
Open |
Range |
Volume |
Thu 04 December 2025 |
1.01 (3.06%) |
0.95 |
0.95 - 1.03 |
0.5395 times |
Fri 28 November 2025 |
0.98 (-4.85%) |
0.99 |
0.95 - 1.02 |
0.5597 times |
Fri 21 November 2025 |
1.03 (7.29%) |
0.94 |
0.92 - 1.03 |
0.5988 times |
Fri 14 November 2025 |
0.96 (-1.03%) |
0.95 |
0.95 - 1.03 |
0.8199 times |
Fri 07 November 2025 |
0.97 (-6.73%) |
0.99 |
0.95 - 1.03 |
0.4541 times |
Fri 31 October 2025 |
1.04 (0%) |
1.00 |
1.00 - 1.06 |
0.3583 times |
Fri 31 October 2025 |
1.04 (9.47%) |
0.92 |
0.92 - 1.06 |
1.8803 times |
Fri 24 October 2025 |
0.95 (13.1%) |
0.85 |
0.83 - 1.02 |
1.1754 times |
Fri 17 October 2025 |
0.84 (0%) |
0.84 |
0.83 - 0.90 |
1.3709 times |
Fri 10 October 2025 |
0.84 (-9.68%) |
0.93 |
0.82 - 0.95 |
2.2431 times |
Fri 03 October 2025 |
0.93 (-2.11%) |
0.97 |
0.88 - 1.02 |
2.6954 times |
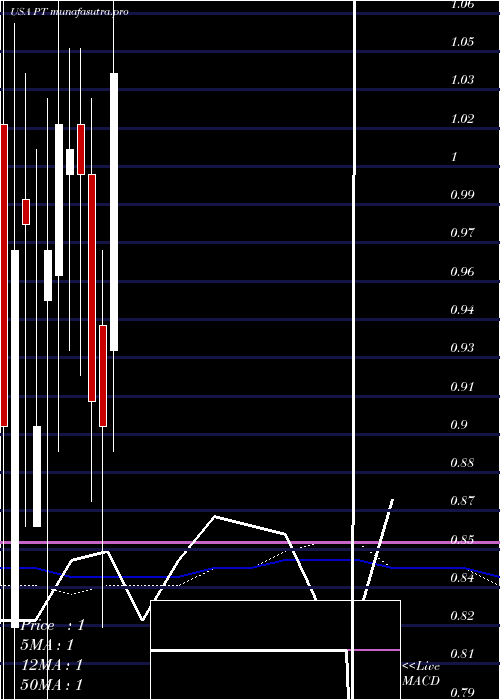
Monthly price and charts PintecTechnology Strong monthly Stock price targets for PintecTechnology PT are 0.98 and 1.06 | Monthly Target 1 | 0.92 | | Monthly Target 2 | 0.96 | | Monthly Target 3 | 0.99666666666667 | | Monthly Target 4 | 1.04 | | Monthly Target 5 | 1.08 |
Monthly price and volumes Pintec Technology
| Date |
Closing |
Open |
Range |
Volume |
Thu 04 December 2025 |
1.01 (3.06%) |
0.95 |
0.95 - 1.03 |
0.0434 times |
Fri 28 November 2025 |
0.98 (-5.77%) |
0.99 |
0.92 - 1.03 |
0.1957 times |
Fri 31 October 2025 |
1.04 (9.47%) |
0.95 |
0.82 - 1.06 |
0.7014 times |
Tue 30 September 2025 |
0.95 (0%) |
0.95 |
0.91 - 1.38 |
8.6848 times |
Fri 29 August 2025 |
0.95 (0%) |
0.95 |
0.88 - 1.04 |
0.0226 times |
Thu 31 July 2025 |
0.95 (5.56%) |
0.93 |
0.82 - 1.09 |
0.0982 times |
Mon 30 June 2025 |
0.90 (-1.1%) |
0.94 |
0.82 - 0.97 |
0.0549 times |
Fri 30 May 2025 |
0.91 (-9%) |
1.00 |
0.87 - 1.03 |
0.0667 times |
Wed 30 April 2025 |
1.00 (-0.99%) |
1.02 |
0.92 - 1.05 |
0.0628 times |
Mon 31 March 2025 |
1.01 (-0.98%) |
1.00 |
0.93 - 1.05 |
0.0694 times |
Fri 28 February 2025 |
1.02 (5.15%) |
0.96 |
0.89 - 1.15 |
0.1836 times |
DMA SMA EMA moving averages of Pintec Technology PT
DMA (daily moving average) of Pintec Technology PT
| DMA period | DMA value | | 5 day DMA | 0.98 | | 12 day DMA | 0.98 | | 20 day DMA | 0.98 | | 35 day DMA | 0.97 | | 50 day DMA | 0.95 | | 100 day DMA | 0.96 | | 150 day DMA | 0.95 | | 200 day DMA | 0.97 | EMA (exponential moving average) of Pintec Technology PT
| EMA period | EMA current | EMA prev | EMA prev2 | | 5 day EMA | 0.98 | 0.97 | 0.97 | | 12 day EMA | 0.99 | 0.99 | 0.99 | | 20 day EMA | 0.97 | 0.97 | 0.97 | | 35 day EMA | 0.95 | 0.95 | 0.95 | | 50 day EMA | 0.95 | 0.95 | 0.95 |
SMA (simple moving average) of Pintec Technology PT
| SMA period | SMA current | SMA prev | SMA prev2 | | 5 day SMA | 0.98 | 0.97 | 0.97 | | 12 day SMA | 0.98 | 0.98 | 0.98 | | 20 day SMA | 0.98 | 0.98 | 0.98 | | 35 day SMA | 0.97 | 0.97 | 0.97 | | 50 day SMA | 0.95 | 0.95 | 0.95 | | 100 day SMA | 0.96 | 0.96 | 0.96 | | 150 day SMA | 0.95 | 0.95 | 0.95 | | 200 day SMA | 0.97 | 0.97 | 0.97 |
|
|
