PricesmartInc PSMT full analysis,charts,indicators,moving averages,SMA,DMA,EMA,ADX,MACD,RSIPricesmart Inc PSMT WideScreen charts, DMA,SMA,EMA technical analysis, forecast prediction, by indicators ADX,MACD,RSI,CCI USA stock exchange
operates under Consumer Services sector & deals in Department Specialty Retail Stores
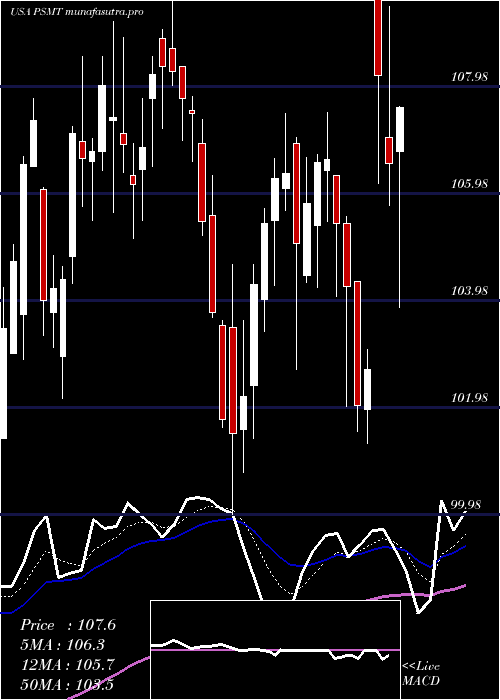
Daily price and charts and targets PricesmartInc Strong Daily Stock price targets for PricesmartInc PSMT are 126.35 and 129.76 | Daily Target 1 | 123.61 | | Daily Target 2 | 125.68 | | Daily Target 3 | 127.02333333333 | | Daily Target 4 | 129.09 | | Daily Target 5 | 130.43 |
Daily price and volume Pricesmart Inc
| Date |
Closing |
Open |
Range |
Volume |
Thu 04 December 2025 |
127.74 (0.83%) |
126.14 |
124.96 - 128.37 |
0.6457 times |
Wed 03 December 2025 |
126.69 (1.12%) |
125.61 |
121.97 - 127.34 |
0.7412 times |
Tue 02 December 2025 |
125.29 (1.99%) |
123.52 |
122.43 - 125.90 |
0.9388 times |
Mon 01 December 2025 |
122.85 (-0.2%) |
122.70 |
122.55 - 124.18 |
1.2646 times |
Fri 28 November 2025 |
123.10 (-0.71%) |
124.04 |
122.24 - 124.65 |
0.5469 times |
Wed 26 November 2025 |
123.98 (-1.34%) |
125.23 |
123.34 - 126.70 |
1.6565 times |
Tue 25 November 2025 |
125.67 (6.89%) |
118.36 |
118.28 - 126.53 |
1.3252 times |
Mon 24 November 2025 |
117.57 (-0.85%) |
119.04 |
117.27 - 119.28 |
1.0337 times |
Fri 21 November 2025 |
118.58 (0.91%) |
117.95 |
117.95 - 120.69 |
1.0397 times |
Thu 20 November 2025 |
117.51 (1.26%) |
117.52 |
116.46 - 119.18 |
0.8078 times |
Wed 19 November 2025 |
116.05 (0.01%) |
116.22 |
114.96 - 116.93 |
0.6102 times |
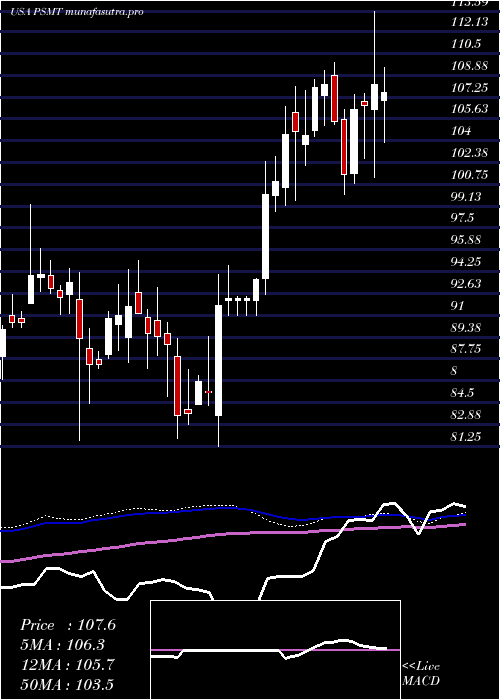
Weekly price and charts PricesmartInc Strong weekly Stock price targets for PricesmartInc PSMT are 124.86 and 131.26 | Weekly Target 1 | 119.63 | | Weekly Target 2 | 123.68 | | Weekly Target 3 | 126.02666666667 | | Weekly Target 4 | 130.08 | | Weekly Target 5 | 132.43 |
Weekly price and volumes for Pricesmart Inc
| Date |
Closing |
Open |
Range |
Volume |
Thu 04 December 2025 |
127.74 (3.77%) |
122.70 |
121.97 - 128.37 |
0.8085 times |
Fri 28 November 2025 |
123.10 (3.81%) |
119.04 |
117.27 - 126.70 |
1.0274 times |
Fri 21 November 2025 |
118.58 (1.61%) |
116.78 |
114.85 - 120.69 |
0.84 times |
Fri 14 November 2025 |
116.70 (-0.04%) |
117.07 |
114.38 - 118.85 |
0.8669 times |
Fri 07 November 2025 |
116.75 (1.57%) |
117.36 |
114.44 - 120.67 |
1.0628 times |
Fri 31 October 2025 |
114.94 (0%) |
118.97 |
111.68 - 123.74 |
0.6222 times |
Fri 31 October 2025 |
114.94 (-6.67%) |
123.35 |
111.68 - 123.74 |
1.5602 times |
Fri 24 October 2025 |
123.15 (1.06%) |
122.89 |
119.39 - 124.01 |
1.0177 times |
Fri 17 October 2025 |
121.86 (2.72%) |
119.39 |
119.39 - 125.48 |
1.0064 times |
Fri 10 October 2025 |
118.63 (-3.73%) |
122.82 |
118.21 - 124.59 |
1.188 times |
Fri 03 October 2025 |
123.22 (1.89%) |
120.78 |
117.85 - 123.61 |
1.5567 times |
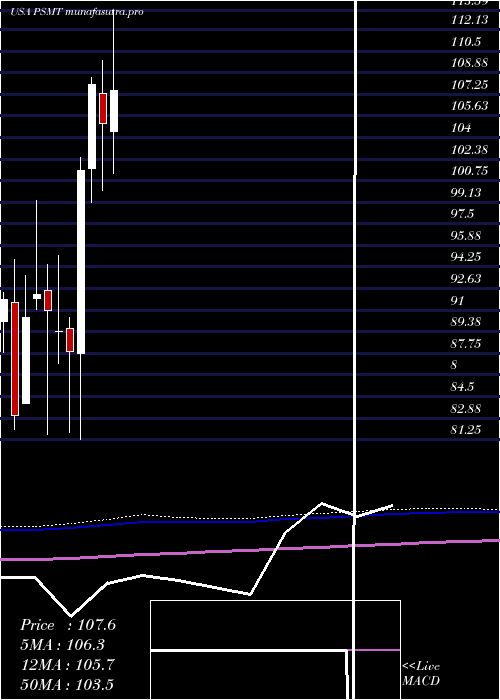
Monthly price and charts PricesmartInc Strong monthly Stock price targets for PricesmartInc PSMT are 124.86 and 131.26 | Monthly Target 1 | 119.63 | | Monthly Target 2 | 123.68 | | Monthly Target 3 | 126.02666666667 | | Monthly Target 4 | 130.08 | | Monthly Target 5 | 132.43 |
Monthly price and volumes Pricesmart Inc
| Date |
Closing |
Open |
Range |
Volume |
Thu 04 December 2025 |
127.74 (3.77%) |
122.70 |
121.97 - 128.37 |
0.1545 times |
Fri 28 November 2025 |
123.10 (7.1%) |
117.36 |
114.38 - 126.70 |
0.7258 times |
Fri 31 October 2025 |
114.94 (-5.16%) |
120.32 |
111.68 - 125.48 |
1.1408 times |
Tue 30 September 2025 |
121.19 (12.99%) |
106.87 |
106.87 - 123.20 |
1.2513 times |
Fri 29 August 2025 |
107.26 (-0.22%) |
107.07 |
105.46 - 114.01 |
0.8778 times |
Thu 31 July 2025 |
107.50 (2.34%) |
104.45 |
101.30 - 113.59 |
1.2092 times |
Mon 30 June 2025 |
105.04 (-2.72%) |
107.34 |
99.98 - 109.84 |
1.07 times |
Fri 30 May 2025 |
107.98 (6.39%) |
101.69 |
99.14 - 108.54 |
0.9111 times |
Wed 30 April 2025 |
101.49 (15.53%) |
87.73 |
81.25 - 102.47 |
1.3565 times |
Mon 31 March 2025 |
87.85 (-1.72%) |
89.62 |
81.80 - 90.43 |
1.303 times |
Fri 28 February 2025 |
89.39 (-1.74%) |
89.36 |
87.01 - 95.08 |
0.9534 times |
DMA SMA EMA moving averages of Pricesmart Inc PSMT
DMA (daily moving average) of Pricesmart Inc PSMT
| DMA period | DMA value | | 5 day DMA | 125.13 | | 12 day DMA | 121.76 | | 20 day DMA | 119.59 | | 35 day DMA | 120.11 | | 50 day DMA | 120.49 | | 100 day DMA | 115.6 | | 150 day DMA | 112.09 | | 200 day DMA | 106.46 | EMA (exponential moving average) of Pricesmart Inc PSMT
| EMA period | EMA current | EMA prev | EMA prev2 | | 5 day EMA | 125.53 | 124.42 | 123.28 | | 12 day EMA | 122.88 | 122 | 121.15 | | 20 day EMA | 121.5 | 120.84 | 120.23 | | 35 day EMA | 120.7 | 120.29 | 119.91 | | 50 day EMA | 120.66 | 120.37 | 120.11 |
SMA (simple moving average) of Pricesmart Inc PSMT
| SMA period | SMA current | SMA prev | SMA prev2 | | 5 day SMA | 125.13 | 124.38 | 124.18 | | 12 day SMA | 121.76 | 120.77 | 119.93 | | 20 day SMA | 119.59 | 119.17 | 118.69 | | 35 day SMA | 120.11 | 120.01 | 119.92 | | 50 day SMA | 120.49 | 120.29 | 120.09 | | 100 day SMA | 115.6 | 115.4 | 115.2 | | 150 day SMA | 112.09 | 111.92 | 111.75 | | 200 day SMA | 106.46 | 106.28 | 106.11 |
|
|
