PrincipalPrice PSET full analysis,charts,indicators,moving averages,SMA,DMA,EMA,ADX,MACD,RSIPrincipal Price PSET WideScreen charts, DMA,SMA,EMA technical analysis, forecast prediction, by indicators ADX,MACD,RSI,CCI USA stock exchange
operates under N A sector & deals in N A
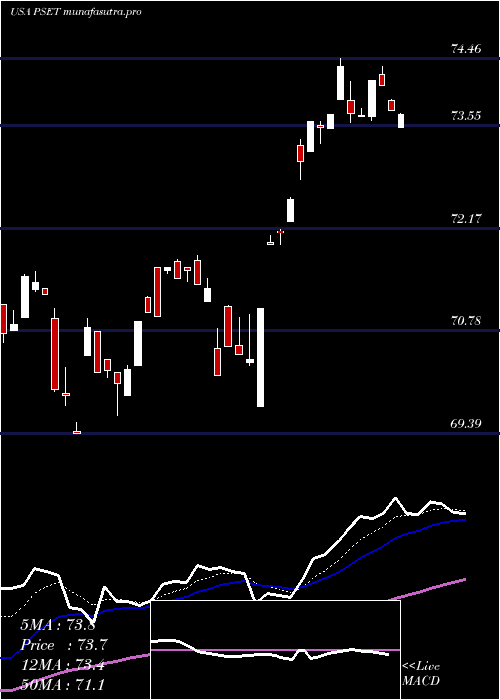
Daily price and charts and targets PrincipalPrice Strong Daily Stock price targets for PrincipalPrice PSET are 76.61 and 76.82 | Daily Target 1 | 76.45 | | Daily Target 2 | 76.56 | | Daily Target 3 | 76.66 | | Daily Target 4 | 76.77 | | Daily Target 5 | 76.87 |
Daily price and volume Principal Price
| Date |
Closing |
Open |
Range |
Volume |
Thu 04 December 2025 |
76.67 (0.13%) |
76.58 |
76.55 - 76.76 |
1.2598 times |
Wed 03 December 2025 |
76.57 (0.21%) |
76.59 |
76.57 - 76.60 |
0.315 times |
Tue 02 December 2025 |
76.41 (0.16%) |
76.29 |
76.29 - 76.41 |
0.315 times |
Mon 01 December 2025 |
76.29 (-0.68%) |
77.03 |
76.29 - 77.03 |
1.1417 times |
Fri 28 November 2025 |
76.81 (0.38%) |
76.76 |
76.76 - 76.81 |
0.1969 times |
Wed 26 November 2025 |
76.52 (0.33%) |
76.40 |
76.40 - 76.65 |
0.9449 times |
Tue 25 November 2025 |
76.27 (1.33%) |
75.58 |
75.58 - 76.27 |
0.3937 times |
Mon 24 November 2025 |
75.27 (1.13%) |
74.87 |
74.79 - 75.35 |
1.0236 times |
Fri 21 November 2025 |
74.43 (1.43%) |
73.81 |
73.81 - 74.72 |
4.0945 times |
Thu 20 November 2025 |
73.38 (-1.25%) |
74.69 |
73.38 - 74.69 |
0.315 times |
Wed 19 November 2025 |
74.31 (0.35%) |
74.34 |
74.08 - 74.34 |
0.3937 times |
Weekly price and charts PrincipalPrice Strong weekly Stock price targets for PrincipalPrice PSET are 76.11 and 76.85 | Weekly Target 1 | 75.92 | | Weekly Target 2 | 76.3 | | Weekly Target 3 | 76.663333333333 | | Weekly Target 4 | 77.04 | | Weekly Target 5 | 77.4 |
Weekly price and volumes for Principal Price
| Date |
Closing |
Open |
Range |
Volume |
Thu 04 December 2025 |
76.67 (-0.18%) |
77.03 |
76.29 - 77.03 |
0.2037 times |
Fri 28 November 2025 |
76.81 (3.2%) |
74.87 |
74.79 - 76.81 |
0.172 times |
Fri 21 November 2025 |
74.43 (-1.18%) |
75.34 |
73.38 - 75.34 |
0.381 times |
Fri 14 November 2025 |
75.32 (-0.23%) |
75.88 |
75.32 - 76.74 |
0.1852 times |
Fri 07 November 2025 |
75.49 (-1.72%) |
75.99 |
74.67 - 76.43 |
0.3783 times |
Fri 31 October 2025 |
76.81 (0%) |
76.89 |
76.58 - 77.04 |
0.0556 times |
Fri 31 October 2025 |
76.81 (-0.39%) |
77.81 |
76.50 - 78.20 |
7.0423 times |
Fri 24 October 2025 |
77.11 (1.9%) |
76.01 |
76.01 - 77.50 |
0.582 times |
Fri 17 October 2025 |
75.67 (1.45%) |
75.65 |
74.17 - 76.16 |
0.7963 times |
Fri 10 October 2025 |
74.59 (-2.94%) |
76.72 |
74.59 - 77.06 |
0.2037 times |
Fri 03 October 2025 |
76.85 (1.49%) |
75.93 |
75.71 - 77.22 |
0.2335 times |
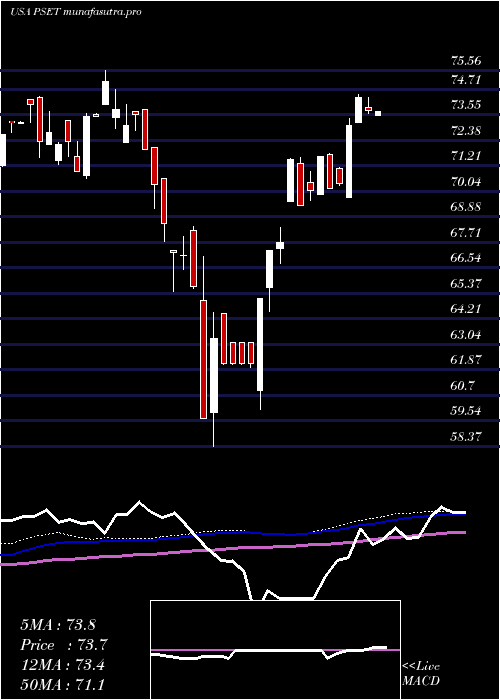
Monthly price and charts PrincipalPrice Strong monthly Stock price targets for PrincipalPrice PSET are 76.11 and 76.85 | Monthly Target 1 | 75.92 | | Monthly Target 2 | 76.3 | | Monthly Target 3 | 76.663333333333 | | Monthly Target 4 | 77.04 | | Monthly Target 5 | 77.4 |
Monthly price and volumes Principal Price
| Date |
Closing |
Open |
Range |
Volume |
Thu 04 December 2025 |
76.67 (-0.18%) |
77.03 |
76.29 - 77.03 |
0.0637 times |
Fri 28 November 2025 |
76.81 (0%) |
75.99 |
73.38 - 76.81 |
0.3493 times |
Fri 31 October 2025 |
76.81 (0.92%) |
75.84 |
74.17 - 78.20 |
2.7472 times |
Tue 30 September 2025 |
76.11 (0.82%) |
74.65 |
74.27 - 76.72 |
0.5686 times |
Fri 29 August 2025 |
75.49 (0.77%) |
73.56 |
73.30 - 75.91 |
1.1289 times |
Thu 31 July 2025 |
74.91 (1.78%) |
73.55 |
73.31 - 76.01 |
0.9448 times |
Mon 30 June 2025 |
73.60 (5.05%) |
69.91 |
69.76 - 73.60 |
0.4122 times |
Fri 30 May 2025 |
70.06 (6.01%) |
66.81 |
66.41 - 71.58 |
1.0172 times |
Wed 30 April 2025 |
66.09 (0.12%) |
65.38 |
58.37 - 67.06 |
2.2848 times |
Mon 31 March 2025 |
66.01 (-6.17%) |
70.62 |
64.95 - 70.62 |
0.4833 times |
Fri 28 February 2025 |
70.35 (-4.64%) |
72.28 |
69.27 - 74.01 |
0.3195 times |
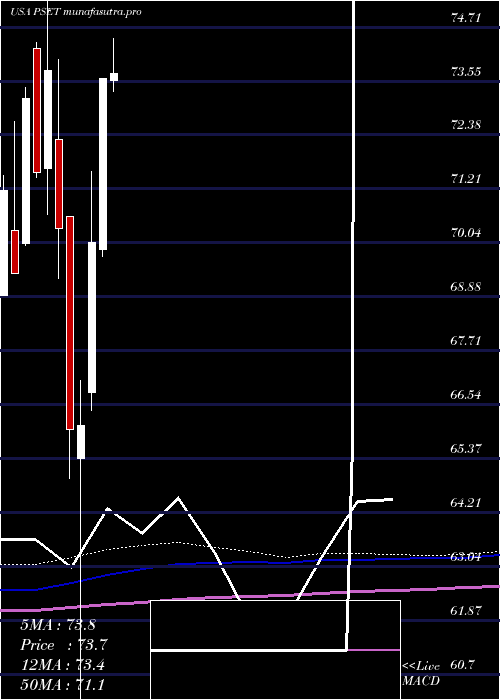
DMA SMA EMA moving averages of Principal Price PSET
DMA (daily moving average) of Principal Price PSET
| DMA period | DMA value | | 5 day DMA | 76.55 | | 12 day DMA | 75.58 | | 20 day DMA | 75.63 | | 35 day DMA | 76.06 | | 50 day DMA | 76.07 | | 100 day DMA | 75.67 | | 150 day DMA | 74.13 | | 200 day DMA | 72.15 | EMA (exponential moving average) of Principal Price PSET
| EMA period | EMA current | EMA prev | EMA prev2 | | 5 day EMA | 76.44 | 76.33 | 76.21 | | 12 day EMA | 76.05 | 75.94 | 75.83 | | 20 day EMA | 75.95 | 75.87 | 75.8 | | 35 day EMA | 75.94 | 75.9 | 75.86 | | 50 day EMA | 76.12 | 76.1 | 76.08 |
SMA (simple moving average) of Principal Price PSET
| SMA period | SMA current | SMA prev | SMA prev2 | | 5 day SMA | 76.55 | 76.52 | 76.46 | | 12 day SMA | 75.58 | 75.4 | 75.29 | | 20 day SMA | 75.63 | 75.6 | 75.57 | | 35 day SMA | 76.06 | 76.03 | 76.01 | | 50 day SMA | 76.07 | 76.05 | 76.04 | | 100 day SMA | 75.67 | 75.64 | 75.61 | | 150 day SMA | 74.13 | 74.06 | 73.98 | | 200 day SMA | 72.15 | 72.13 | 72.12 |
|
|
