InvescoS PSCI full analysis,charts,indicators,moving averages,SMA,DMA,EMA,ADX,MACD,RSIInvesco S PSCI WideScreen charts, DMA,SMA,EMA technical analysis, forecast prediction, by indicators ADX,MACD,RSI,CCI USA stock exchange
operates under N A sector & deals in N A
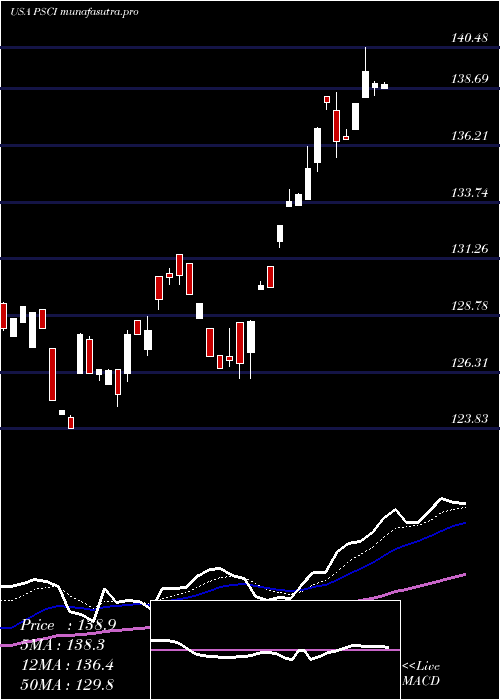
Daily price and charts and targets InvescoS Strong Daily Stock price targets for InvescoS PSCI are 149.88 and 150.84 | Daily Target 1 | 149.11 | | Daily Target 2 | 149.68 | | Daily Target 3 | 150.06666666667 | | Daily Target 4 | 150.64 | | Daily Target 5 | 151.03 |
Daily price and volume Invesco S
| Date |
Closing |
Open |
Range |
Volume |
Mon 20 October 2025 |
150.26 (1.46%) |
149.49 |
149.49 - 150.45 |
1.3021 times |
Fri 17 October 2025 |
148.10 (-0.56%) |
148.48 |
147.77 - 148.48 |
0.6771 times |
Thu 16 October 2025 |
148.94 (-0.64%) |
150.20 |
148.80 - 150.51 |
1.0938 times |
Wed 15 October 2025 |
149.90 (0.66%) |
149.86 |
148.95 - 150.01 |
0.8854 times |
Tue 14 October 2025 |
148.91 (1.5%) |
144.53 |
144.53 - 149.61 |
0.7813 times |
Mon 13 October 2025 |
146.71 (1.8%) |
145.56 |
145.56 - 147.00 |
1.25 times |
Fri 10 October 2025 |
144.11 (-2.93%) |
149.05 |
144.11 - 149.05 |
1.1979 times |
Thu 09 October 2025 |
148.46 (-1.67%) |
149.11 |
148.34 - 149.11 |
0.5729 times |
Wed 08 October 2025 |
150.98 (1.49%) |
149.72 |
149.72 - 151.00 |
0.8333 times |
Tue 07 October 2025 |
148.76 (-1.33%) |
150.75 |
148.57 - 151.20 |
1.4063 times |
Mon 06 October 2025 |
150.76 (0.1%) |
151.00 |
150.76 - 151.08 |
0.7292 times |
Weekly price and charts InvescoS Strong weekly Stock price targets for InvescoS PSCI are 149.88 and 150.84 | Weekly Target 1 | 149.11 | | Weekly Target 2 | 149.68 | | Weekly Target 3 | 150.06666666667 | | Weekly Target 4 | 150.64 | | Weekly Target 5 | 151.03 |
Weekly price and volumes for Invesco S
| Date |
Closing |
Open |
Range |
Volume |
Mon 20 October 2025 |
150.26 (1.46%) |
149.49 |
149.49 - 150.45 |
0.2194 times |
Fri 17 October 2025 |
148.10 (2.77%) |
145.56 |
144.53 - 150.51 |
0.7899 times |
Fri 10 October 2025 |
144.11 (-4.32%) |
151.00 |
144.11 - 151.20 |
0.7987 times |
Fri 03 October 2025 |
150.61 (1.37%) |
150.02 |
147.88 - 151.75 |
1.2144 times |
Fri 26 September 2025 |
148.57 (-0.81%) |
150.18 |
146.51 - 152.07 |
0.7285 times |
Fri 19 September 2025 |
149.78 (1.23%) |
148.39 |
147.39 - 151.58 |
0.5793 times |
Fri 12 September 2025 |
147.96 (-0.58%) |
148.12 |
145.31 - 150.31 |
3.6863 times |
Fri 05 September 2025 |
148.82 (0.65%) |
145.85 |
145.58 - 149.84 |
0.7548 times |
Fri 29 August 2025 |
147.86 (0%) |
149.82 |
147.69 - 149.82 |
0.3072 times |
Fri 29 August 2025 |
147.86 (-1.35%) |
149.64 |
147.69 - 150.47 |
0.9216 times |
Fri 22 August 2025 |
149.88 (3.32%) |
145.37 |
143.98 - 150.23 |
1.0006 times |
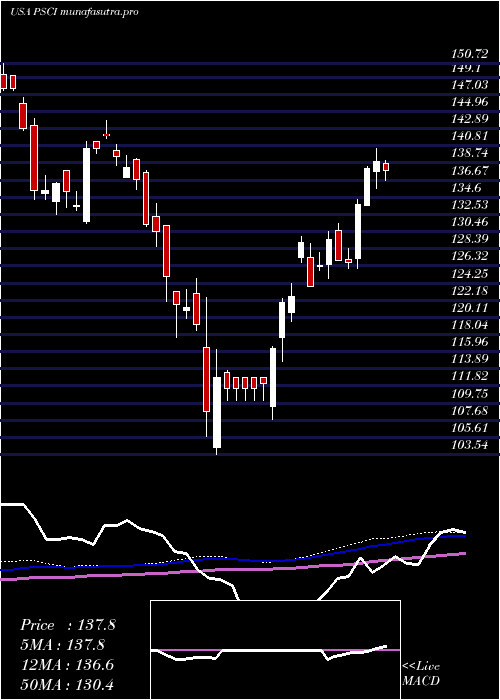
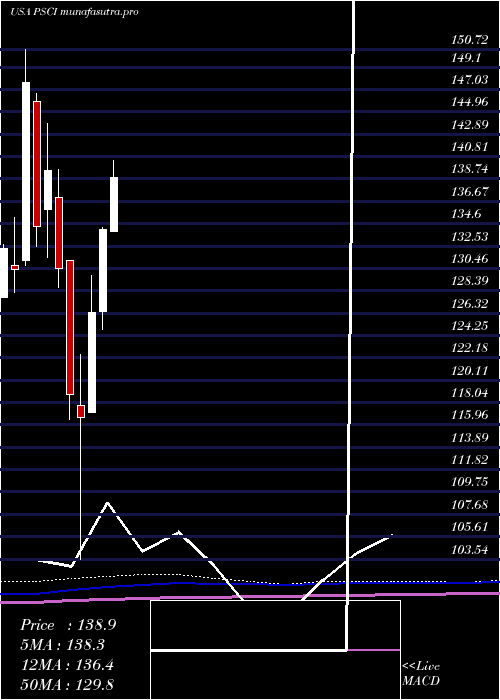
Monthly price and charts InvescoS Strong monthly Stock price targets for InvescoS PSCI are 147.19 and 154.83 | Monthly Target 1 | 141.07 | | Monthly Target 2 | 145.66 | | Monthly Target 3 | 148.70666666667 | | Monthly Target 4 | 153.3 | | Monthly Target 5 | 156.35 |
Monthly price and volumes Invesco S
| Date |
Closing |
Open |
Range |
Volume |
Mon 20 October 2025 |
150.26 (0.55%) |
149.08 |
144.11 - 151.75 |
0.1809 times |
Tue 30 September 2025 |
149.44 (1.07%) |
145.85 |
145.31 - 152.07 |
0.4902 times |
Fri 29 August 2025 |
147.86 (5.02%) |
137.18 |
136.18 - 150.47 |
0.4143 times |
Thu 31 July 2025 |
140.79 (5.02%) |
133.84 |
133.84 - 143.45 |
0.4353 times |
Mon 30 June 2025 |
134.06 (6.09%) |
126.43 |
124.79 - 134.28 |
0.5668 times |
Fri 30 May 2025 |
126.37 (8.35%) |
117.09 |
117.09 - 129.82 |
0.3371 times |
Wed 30 April 2025 |
116.63 (-1.83%) |
117.73 |
103.54 - 122.50 |
4.2024 times |
Mon 31 March 2025 |
118.80 (-8.94%) |
131.16 |
116.50 - 131.16 |
0.9162 times |
Fri 28 February 2025 |
130.47 (-6.46%) |
137.01 |
128.68 - 139.65 |
0.8206 times |
Fri 31 January 2025 |
139.48 (3.8%) |
135.88 |
131.48 - 143.92 |
1.6362 times |
Tue 31 December 2024 |
134.37 (-9.02%) |
145.94 |
132.52 - 146.65 |
1.7805 times |
DMA SMA EMA moving averages of Invesco S PSCI
DMA (daily moving average) of Invesco S PSCI
| DMA period | DMA value | | 5 day DMA | 149.22 | | 12 day DMA | 148.88 | | 20 day DMA | 148.88 | | 35 day DMA | 148.69 | | 50 day DMA | 148.32 | | 100 day DMA | 141.54 | | 150 day DMA | 133.95 | | 200 day DMA | 134.04 | EMA (exponential moving average) of Invesco S PSCI
| EMA period | EMA current | EMA prev | EMA prev2 | | 5 day EMA | 149.08 | 148.49 | 148.69 | | 12 day EMA | 148.86 | 148.61 | 148.7 | | 20 day EMA | 148.78 | 148.62 | 148.67 | | 35 day EMA | 148.3 | 148.18 | 148.18 | | 50 day EMA | 147.85 | 147.75 | 147.74 |
SMA (simple moving average) of Invesco S PSCI
| SMA period | SMA current | SMA prev | SMA prev2 | | 5 day SMA | 149.22 | 148.51 | 147.71 | | 12 day SMA | 148.88 | 148.88 | 149.01 | | 20 day SMA | 148.88 | 148.92 | 149 | | 35 day SMA | 148.69 | 148.62 | 148.61 | | 50 day SMA | 148.32 | 148.15 | 148.02 | | 100 day SMA | 141.54 | 141.32 | 141.08 | | 150 day SMA | 133.95 | 133.76 | 133.57 | | 200 day SMA | 134.04 | 133.96 | 133.89 |
|
|
