InvescoS PSCE full analysis,charts,indicators,moving averages,SMA,DMA,EMA,ADX,MACD,RSIInvesco S PSCE WideScreen charts, DMA,SMA,EMA technical analysis, forecast prediction, by indicators ADX,MACD,RSI,CCI USA stock exchange
operates under N A sector & deals in N A
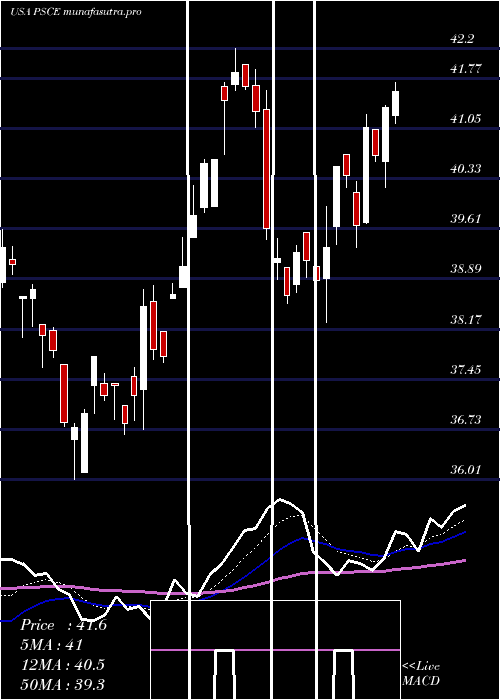
Daily price and charts and targets InvescoS Strong Daily Stock price targets for InvescoS PSCE are 41.66 and 42.43 | Daily Target 1 | 41.08 | | Daily Target 2 | 41.47 | | Daily Target 3 | 41.846666666667 | | Daily Target 4 | 42.24 | | Daily Target 5 | 42.62 |
Daily price and volume Invesco S
| Date |
Closing |
Open |
Range |
Volume |
Mon 20 October 2025 |
41.87 (1.58%) |
41.45 |
41.45 - 42.22 |
0.3594 times |
Fri 17 October 2025 |
41.22 (0.68%) |
40.70 |
40.67 - 41.39 |
0.3644 times |
Thu 16 October 2025 |
40.94 (-1.49%) |
41.81 |
40.68 - 41.92 |
0.7336 times |
Wed 15 October 2025 |
41.56 (-0.67%) |
42.55 |
41.43 - 42.55 |
0.9109 times |
Tue 14 October 2025 |
41.84 (-0.19%) |
41.20 |
41.14 - 42.12 |
0.6795 times |
Mon 13 October 2025 |
41.92 (3.35%) |
41.02 |
40.84 - 41.97 |
3.3087 times |
Fri 10 October 2025 |
40.56 (-5.1%) |
42.47 |
40.53 - 42.60 |
1.9399 times |
Thu 09 October 2025 |
42.74 (-2.33%) |
43.82 |
42.69 - 44.06 |
0.5219 times |
Wed 08 October 2025 |
43.76 (0.57%) |
43.70 |
43.28 - 43.78 |
0.2363 times |
Tue 07 October 2025 |
43.51 (0.42%) |
43.33 |
42.83 - 43.54 |
0.9453 times |
Mon 06 October 2025 |
43.33 (0%) |
43.90 |
43.31 - 43.93 |
1.8021 times |
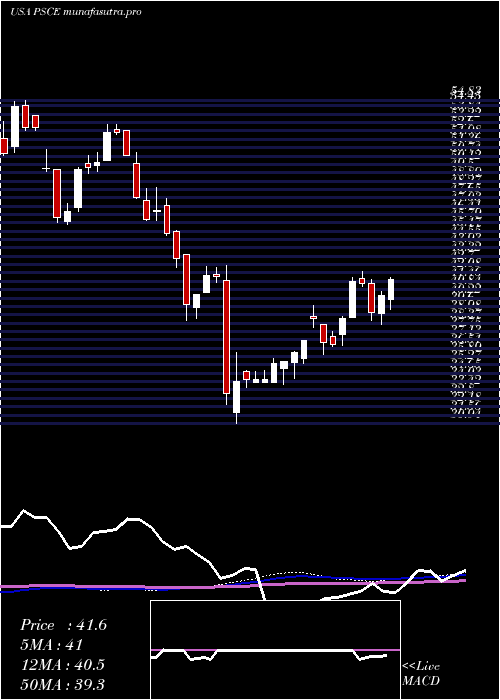
Weekly price and charts InvescoS Strong weekly Stock price targets for InvescoS PSCE are 41.66 and 42.43 | Weekly Target 1 | 41.08 | | Weekly Target 2 | 41.47 | | Weekly Target 3 | 41.846666666667 | | Weekly Target 4 | 42.24 | | Weekly Target 5 | 42.62 |
Weekly price and volumes for Invesco S
| Date |
Closing |
Open |
Range |
Volume |
Mon 20 October 2025 |
41.87 (1.58%) |
41.45 |
41.45 - 42.22 |
0.1008 times |
Fri 17 October 2025 |
41.22 (1.63%) |
41.02 |
40.67 - 42.55 |
1.6816 times |
Fri 10 October 2025 |
40.56 (-6.39%) |
43.90 |
40.53 - 44.06 |
1.5269 times |
Fri 03 October 2025 |
43.33 (-1.92%) |
44.30 |
42.13 - 44.30 |
1.8863 times |
Fri 26 September 2025 |
44.18 (6.48%) |
41.19 |
40.94 - 44.70 |
1.5311 times |
Fri 19 September 2025 |
41.49 (1.05%) |
41.47 |
41.13 - 42.70 |
0.769 times |
Fri 12 September 2025 |
41.06 (-0.29%) |
41.54 |
40.40 - 41.70 |
0.9747 times |
Fri 05 September 2025 |
41.18 (-1.67%) |
41.70 |
40.63 - 41.81 |
0.6931 times |
Fri 29 August 2025 |
41.88 (0%) |
41.74 |
41.62 - 41.99 |
0.1243 times |
Fri 29 August 2025 |
41.88 (2.15%) |
41.04 |
40.52 - 41.99 |
0.7124 times |
Fri 22 August 2025 |
41.00 (4.65%) |
39.14 |
38.51 - 41.17 |
0.5288 times |
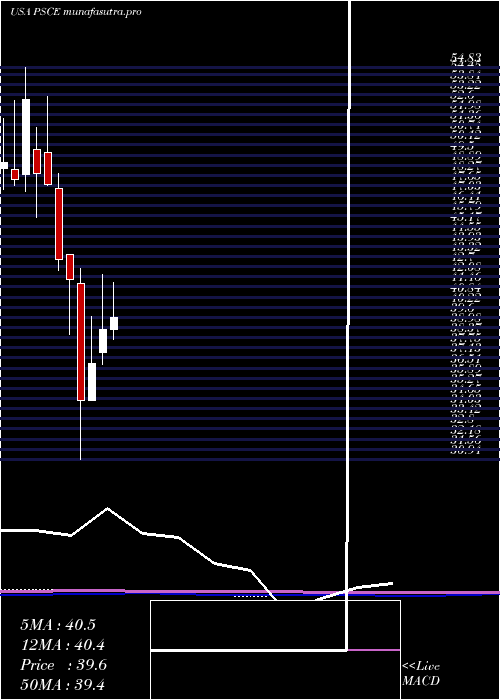
Monthly price and charts InvescoS Strong monthly Stock price targets for InvescoS PSCE are 39.44 and 42.97 | Monthly Target 1 | 38.62 | | Monthly Target 2 | 40.25 | | Monthly Target 3 | 42.153333333333 | | Monthly Target 4 | 43.78 | | Monthly Target 5 | 45.68 |
Monthly price and volumes Invesco S
| Date |
Closing |
Open |
Range |
Volume |
Mon 20 October 2025 |
41.87 (-1.76%) |
42.25 |
40.53 - 44.06 |
0.9119 times |
Tue 30 September 2025 |
42.62 (1.77%) |
41.70 |
40.40 - 44.70 |
0.9394 times |
Fri 29 August 2025 |
41.88 (5.44%) |
39.30 |
37.88 - 41.99 |
0.762 times |
Thu 31 July 2025 |
39.72 (2.21%) |
38.89 |
38.26 - 42.01 |
0.9326 times |
Mon 30 June 2025 |
38.86 (5.57%) |
37.49 |
36.73 - 42.20 |
0.8016 times |
Fri 30 May 2025 |
36.81 (6.54%) |
34.51 |
34.51 - 39.64 |
0.7576 times |
Wed 30 April 2025 |
34.55 (-17.54%) |
41.67 |
30.94 - 42.61 |
1.5509 times |
Mon 31 March 2025 |
41.90 (-2.85%) |
43.46 |
38.55 - 43.46 |
1.0786 times |
Fri 28 February 2025 |
43.13 (-9.56%) |
47.45 |
42.45 - 48.38 |
1.1157 times |
Fri 31 January 2025 |
47.69 (-1.47%) |
49.65 |
47.63 - 53.10 |
1.1498 times |
Tue 31 December 2024 |
48.40 (-8.47%) |
49.83 |
45.67 - 51.22 |
2.3447 times |
DMA SMA EMA moving averages of Invesco S PSCE
DMA (daily moving average) of Invesco S PSCE
| DMA period | DMA value | | 5 day DMA | 41.49 | | 12 day DMA | 42.22 | | 20 day DMA | 42.63 | | 35 day DMA | 42.13 | | 50 day DMA | 41.57 | | 100 day DMA | 40.64 | | 150 day DMA | 39.46 | | 200 day DMA | 41.32 | EMA (exponential moving average) of Invesco S PSCE
| EMA period | EMA current | EMA prev | EMA prev2 | | 5 day EMA | 41.6 | 41.46 | 41.58 | | 12 day EMA | 41.95 | 41.96 | 42.09 | | 20 day EMA | 42.07 | 42.09 | 42.18 | | 35 day EMA | 41.81 | 41.81 | 41.84 | | 50 day EMA | 41.35 | 41.33 | 41.33 |
SMA (simple moving average) of Invesco S PSCE
| SMA period | SMA current | SMA prev | SMA prev2 | | 5 day SMA | 41.49 | 41.5 | 41.36 | | 12 day SMA | 42.22 | 42.26 | 42.43 | | 20 day SMA | 42.63 | 42.61 | 42.63 | | 35 day SMA | 42.13 | 42.13 | 42.15 | | 50 day SMA | 41.57 | 41.5 | 41.46 | | 100 day SMA | 40.64 | 40.6 | 40.56 | | 150 day SMA | 39.46 | 39.45 | 39.44 | | 200 day SMA | 41.32 | 41.36 | 41.39 |
|
|
