US PRTS full analysis,charts,indicators,moving averages,SMA,DMA,EMA,ADX,MACD,RSIU S PRTS WideScreen charts, DMA,SMA,EMA technical analysis, forecast prediction, by indicators ADX,MACD,RSI,CCI USA stock exchange
operates under Consumer Services sector & deals in Other Specialty Stores
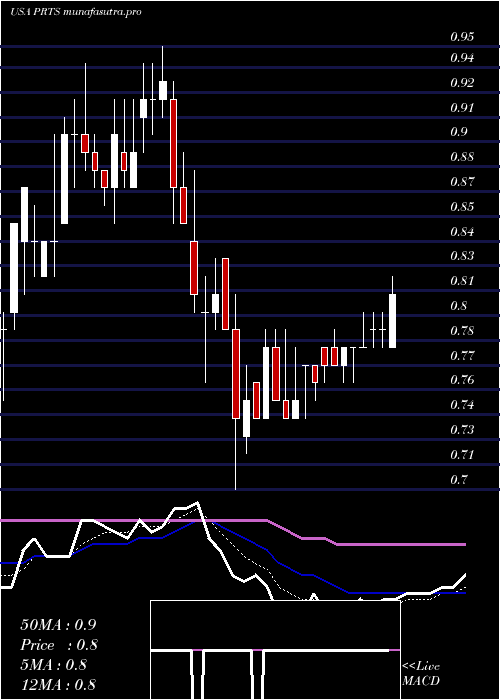
Daily price and charts and targets US Strong Daily Stock price targets for US PRTS are 0.42 and 0.46 | Daily Target 1 | 0.41 | | Daily Target 2 | 0.43 | | Daily Target 3 | 0.45333333333333 | | Daily Target 4 | 0.47 | | Daily Target 5 | 0.49 |
Daily price and volume U S
| Date |
Closing |
Open |
Range |
Volume |
Fri 05 December 2025 |
0.44 (0%) |
0.48 |
0.44 - 0.48 |
1.6492 times |
Thu 04 December 2025 |
0.44 (-6.38%) |
0.47 |
0.44 - 0.48 |
2.5068 times |
Wed 03 December 2025 |
0.47 (-4.08%) |
0.49 |
0.47 - 0.50 |
1.0318 times |
Tue 02 December 2025 |
0.49 (-5.77%) |
0.51 |
0.48 - 0.51 |
0.8568 times |
Mon 01 December 2025 |
0.52 (-3.7%) |
0.53 |
0.52 - 0.54 |
0.5827 times |
Fri 28 November 2025 |
0.54 (3.85%) |
0.53 |
0.52 - 0.54 |
0.315 times |
Wed 26 November 2025 |
0.52 (0%) |
0.51 |
0.51 - 0.54 |
0.933 times |
Tue 25 November 2025 |
0.52 (6.12%) |
0.50 |
0.50 - 0.52 |
0.7907 times |
Mon 24 November 2025 |
0.49 (6.52%) |
0.46 |
0.46 - 0.49 |
0.6174 times |
Fri 21 November 2025 |
0.46 (4.55%) |
0.43 |
0.43 - 0.46 |
0.7165 times |
Thu 20 November 2025 |
0.44 (-4.35%) |
0.45 |
0.43 - 0.48 |
0.9728 times |
Weekly price and charts US Strong weekly Stock price targets for US PRTS are 0.39 and 0.49 | Weekly Target 1 | 0.37 | | Weekly Target 2 | 0.41 | | Weekly Target 3 | 0.47333333333333 | | Weekly Target 4 | 0.51 | | Weekly Target 5 | 0.57 |
Weekly price and volumes for U S
| Date |
Closing |
Open |
Range |
Volume |
Fri 05 December 2025 |
0.44 (-18.52%) |
0.53 |
0.44 - 0.54 |
1.3174 times |
Fri 28 November 2025 |
0.54 (17.39%) |
0.46 |
0.46 - 0.54 |
0.528 times |
Fri 21 November 2025 |
0.46 (-14.81%) |
0.52 |
0.43 - 0.54 |
0.9616 times |
Fri 14 November 2025 |
0.54 (-12.9%) |
0.63 |
0.46 - 0.65 |
2.6348 times |
Fri 07 November 2025 |
0.62 (-10.14%) |
0.66 |
0.61 - 0.68 |
0.6917 times |
Fri 31 October 2025 |
0.69 (0%) |
0.71 |
0.68 - 0.71 |
0.1224 times |
Fri 31 October 2025 |
0.69 (0%) |
0.72 |
0.67 - 0.75 |
0.7664 times |
Fri 24 October 2025 |
0.69 (7.81%) |
0.66 |
0.65 - 0.72 |
0.7609 times |
Fri 17 October 2025 |
0.64 (-1.54%) |
0.68 |
0.64 - 0.70 |
0.6893 times |
Fri 10 October 2025 |
0.65 (-8.45%) |
0.72 |
0.64 - 0.73 |
1.5274 times |
Fri 03 October 2025 |
0.71 (-5.33%) |
0.75 |
0.70 - 0.76 |
1.0446 times |
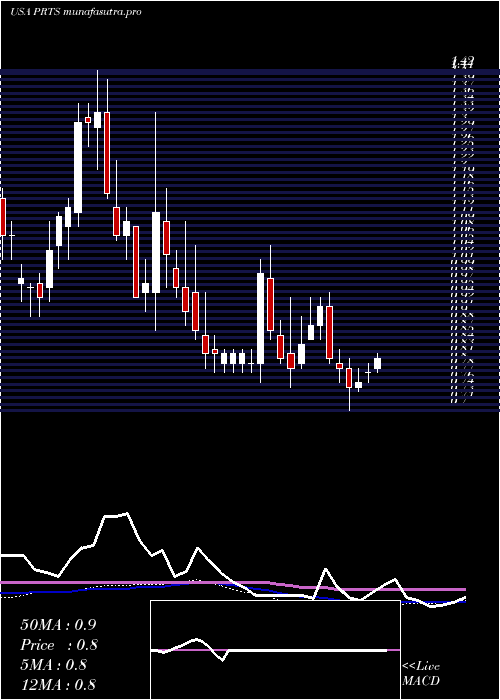
Monthly price and charts US Strong monthly Stock price targets for US PRTS are 0.39 and 0.49 | Monthly Target 1 | 0.37 | | Monthly Target 2 | 0.41 | | Monthly Target 3 | 0.47333333333333 | | Monthly Target 4 | 0.51 | | Monthly Target 5 | 0.57 |
Monthly price and volumes U S
| Date |
Closing |
Open |
Range |
Volume |
Fri 05 December 2025 |
0.44 (-18.52%) |
0.53 |
0.44 - 0.54 |
0.3119 times |
Fri 28 November 2025 |
0.54 (-21.74%) |
0.66 |
0.43 - 0.68 |
1.1404 times |
Fri 31 October 2025 |
0.69 (-2.82%) |
0.71 |
0.64 - 0.75 |
1.0633 times |
Tue 30 September 2025 |
0.71 (-13.41%) |
0.83 |
0.70 - 1.36 |
2.4617 times |
Fri 29 August 2025 |
0.82 (-2.38%) |
0.81 |
0.70 - 0.94 |
0.9998 times |
Thu 31 July 2025 |
0.84 (13.51%) |
0.74 |
0.74 - 0.90 |
0.5358 times |
Mon 30 June 2025 |
0.74 (-15.91%) |
0.88 |
0.70 - 0.95 |
0.5259 times |
Fri 30 May 2025 |
0.88 (-4.35%) |
0.91 |
0.75 - 0.96 |
1.0186 times |
Wed 30 April 2025 |
0.92 (-8%) |
0.99 |
0.76 - 1.05 |
0.6227 times |
Mon 31 March 2025 |
1.00 (3.09%) |
0.95 |
0.87 - 1.33 |
1.3198 times |
Fri 28 February 2025 |
0.97 (-16.38%) |
1.13 |
0.91 - 1.23 |
0.5011 times |

DMA SMA EMA moving averages of U S PRTS
DMA (daily moving average) of U S PRTS
| DMA period | DMA value | | 5 day DMA | 0.47 | | 12 day DMA | 0.48 | | 20 day DMA | 0.51 | | 35 day DMA | 0.57 | | 50 day DMA | 0.61 | | 100 day DMA | 0.72 | | 150 day DMA | 0.75 | | 200 day DMA | 0.8 | EMA (exponential moving average) of U S PRTS
| EMA period | EMA current | EMA prev | EMA prev2 | | 5 day EMA | 0.46 | 0.47 | 0.49 | | 12 day EMA | 0.48 | 0.49 | 0.5 | | 20 day EMA | 0.52 | 0.53 | 0.54 | | 35 day EMA | 0.55 | 0.56 | 0.57 | | 50 day EMA | 0.6 | 0.61 | 0.62 |
SMA (simple moving average) of U S PRTS
| SMA period | SMA current | SMA prev | SMA prev2 | | 5 day SMA | 0.47 | 0.49 | 0.51 | | 12 day SMA | 0.48 | 0.49 | 0.49 | | 20 day SMA | 0.51 | 0.52 | 0.53 | | 35 day SMA | 0.57 | 0.58 | 0.59 | | 50 day SMA | 0.61 | 0.62 | 0.63 | | 100 day SMA | 0.72 | 0.72 | 0.73 | | 150 day SMA | 0.75 | 0.76 | 0.76 | | 200 day SMA | 0.8 | 0.81 | 0.81 |
|
|
