ProthenaCorporation PRTA full analysis,charts,indicators,moving averages,SMA,DMA,EMA,ADX,MACD,RSIProthena Corporation PRTA WideScreen charts, DMA,SMA,EMA technical analysis, forecast prediction, by indicators ADX,MACD,RSI,CCI USA stock exchange
operates under Health Care sector & deals in Major Pharmaceuticals
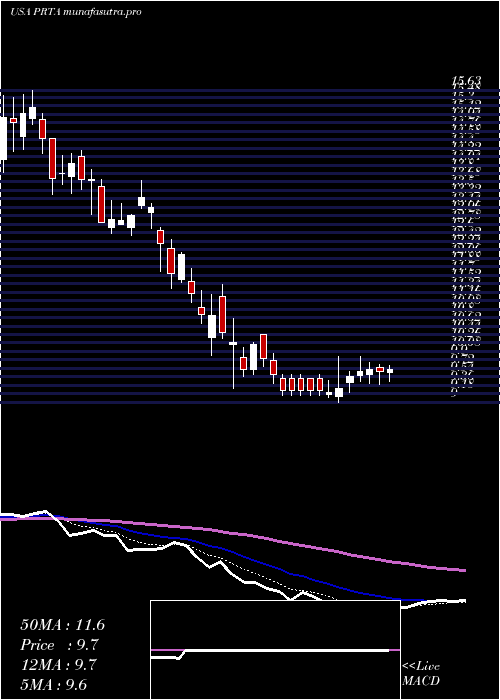
Daily price and charts and targets ProthenaCorporation Strong Daily Stock price targets for ProthenaCorporation PRTA are 10.17 and 10.76 | Daily Target 1 | 9.7 | | Daily Target 2 | 10.04 | | Daily Target 3 | 10.293333333333 | | Daily Target 4 | 10.63 | | Daily Target 5 | 10.88 |
Daily price and volume Prothena Corporation
| Date |
Closing |
Open |
Range |
Volume |
Mon 20 October 2025 |
10.37 (4.54%) |
10.05 |
9.96 - 10.55 |
0.7896 times |
Fri 17 October 2025 |
9.92 (-1.68%) |
9.99 |
9.61 - 10.23 |
1.0982 times |
Thu 16 October 2025 |
10.09 (-5.35%) |
10.76 |
10.03 - 10.90 |
0.8827 times |
Wed 15 October 2025 |
10.66 (5.34%) |
10.12 |
10.12 - 10.72 |
1.1329 times |
Tue 14 October 2025 |
10.12 (-2.22%) |
10.32 |
10.03 - 10.32 |
0.5538 times |
Mon 13 October 2025 |
10.35 (2.99%) |
10.03 |
10.00 - 10.35 |
0.9934 times |
Fri 10 October 2025 |
10.05 (-2.43%) |
10.34 |
9.98 - 10.45 |
1.037 times |
Thu 09 October 2025 |
10.30 (-0.48%) |
10.43 |
10.28 - 10.65 |
1.1321 times |
Wed 08 October 2025 |
10.35 (1.77%) |
10.27 |
10.13 - 10.54 |
0.9196 times |
Tue 07 October 2025 |
10.17 (3.14%) |
10.12 |
9.92 - 10.37 |
1.4606 times |
Mon 06 October 2025 |
9.86 (-0.6%) |
10.00 |
9.77 - 10.09 |
0.4852 times |
Weekly price and charts ProthenaCorporation Strong weekly Stock price targets for ProthenaCorporation PRTA are 10.17 and 10.76 | Weekly Target 1 | 9.7 | | Weekly Target 2 | 10.04 | | Weekly Target 3 | 10.293333333333 | | Weekly Target 4 | 10.63 | | Weekly Target 5 | 10.88 |
Weekly price and volumes for Prothena Corporation
| Date |
Closing |
Open |
Range |
Volume |
Mon 20 October 2025 |
10.37 (4.54%) |
10.05 |
9.96 - 10.55 |
0.1669 times |
Fri 17 October 2025 |
9.92 (-1.29%) |
10.03 |
9.61 - 10.90 |
0.9851 times |
Fri 10 October 2025 |
10.05 (1.31%) |
10.00 |
9.77 - 10.65 |
1.0641 times |
Fri 03 October 2025 |
9.92 (5.42%) |
9.43 |
9.21 - 10.46 |
1.2919 times |
Fri 26 September 2025 |
9.41 (16.6%) |
8.12 |
8.02 - 9.56 |
1.2884 times |
Fri 19 September 2025 |
8.07 (-1.71%) |
8.18 |
8.04 - 8.39 |
0.8818 times |
Fri 12 September 2025 |
8.21 (-3.98%) |
8.61 |
8.10 - 8.62 |
0.9913 times |
Fri 05 September 2025 |
8.55 (4.27%) |
8.17 |
8.06 - 8.59 |
1.2986 times |
Fri 29 August 2025 |
8.20 (0%) |
8.27 |
8.08 - 8.34 |
0.2697 times |
Fri 29 August 2025 |
8.20 (-6.5%) |
8.76 |
8.05 - 8.79 |
1.7622 times |
Fri 22 August 2025 |
8.77 (6.3%) |
8.36 |
8.28 - 8.97 |
1.414 times |
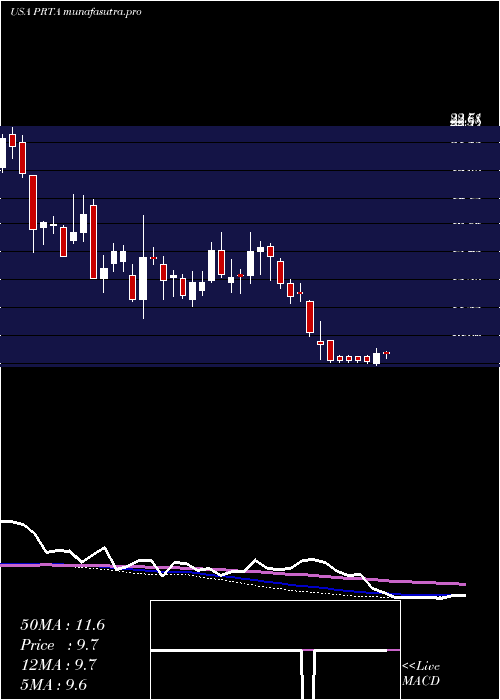
Monthly price and charts ProthenaCorporation Strong monthly Stock price targets for ProthenaCorporation PRTA are 9.98 and 11.3 | Monthly Target 1 | 8.96 | | Monthly Target 2 | 9.67 | | Monthly Target 3 | 10.283333333333 | | Monthly Target 4 | 10.99 | | Monthly Target 5 | 11.6 |
Monthly price and volumes Prothena Corporation
| Date |
Closing |
Open |
Range |
Volume |
Mon 20 October 2025 |
10.37 (6.25%) |
9.79 |
9.58 - 10.90 |
0.4942 times |
Tue 30 September 2025 |
9.76 (19.02%) |
8.17 |
8.02 - 9.85 |
0.8498 times |
Fri 29 August 2025 |
8.20 (19.36%) |
6.80 |
6.61 - 8.97 |
1.2329 times |
Thu 31 July 2025 |
6.87 (13.18%) |
6.06 |
5.96 - 7.33 |
0.925 times |
Mon 30 June 2025 |
6.07 (32.24%) |
4.56 |
4.53 - 6.41 |
1.7762 times |
Fri 30 May 2025 |
4.59 (-50.11%) |
9.21 |
4.32 - 9.50 |
2.8711 times |
Wed 30 April 2025 |
9.20 (-25.69%) |
12.27 |
9.00 - 12.45 |
0.648 times |
Mon 31 March 2025 |
12.38 (-21.7%) |
15.85 |
11.78 - 16.05 |
0.4142 times |
Fri 28 February 2025 |
15.81 (11.1%) |
13.80 |
13.15 - 16.67 |
0.3447 times |
Fri 31 January 2025 |
14.23 (2.74%) |
14.01 |
12.39 - 16.64 |
0.444 times |
Tue 31 December 2024 |
13.85 (-11.1%) |
14.18 |
11.70 - 17.66 |
0.6312 times |

DMA SMA EMA moving averages of Prothena Corporation PRTA
DMA (daily moving average) of Prothena Corporation PRTA
| DMA period | DMA value | | 5 day DMA | 10.23 | | 12 day DMA | 10.18 | | 20 day DMA | 9.92 | | 35 day DMA | 9.22 | | 50 day DMA | 8.95 | | 100 day DMA | 7.54 | | 150 day DMA | 8.18 | | 200 day DMA | 9.73 | EMA (exponential moving average) of Prothena Corporation PRTA
| EMA period | EMA current | EMA prev | EMA prev2 | | 5 day EMA | 10.22 | 10.14 | 10.25 | | 12 day EMA | 10.09 | 10.04 | 10.06 | | 20 day EMA | 9.85 | 9.79 | 9.78 | | 35 day EMA | 9.44 | 9.39 | 9.36 | | 50 day EMA | 8.97 | 8.91 | 8.87 |
SMA (simple moving average) of Prothena Corporation PRTA
| SMA period | SMA current | SMA prev | SMA prev2 | | 5 day SMA | 10.23 | 10.23 | 10.25 | | 12 day SMA | 10.18 | 10.18 | 10.18 | | 20 day SMA | 9.92 | 9.82 | 9.72 | | 35 day SMA | 9.22 | 9.15 | 9.1 | | 50 day SMA | 8.95 | 8.89 | 8.85 | | 100 day SMA | 7.54 | 7.48 | 7.45 | | 150 day SMA | 8.18 | 8.2 | 8.23 | | 200 day SMA | 9.73 | 9.75 | 9.77 |
|
|
