PrimericaInc PRI full analysis,charts,indicators,moving averages,SMA,DMA,EMA,ADX,MACD,RSIPrimerica Inc PRI WideScreen charts, DMA,SMA,EMA technical analysis, forecast prediction, by indicators ADX,MACD,RSI,CCI USA stock exchange
operates under Finance sector & deals in Life Insurance
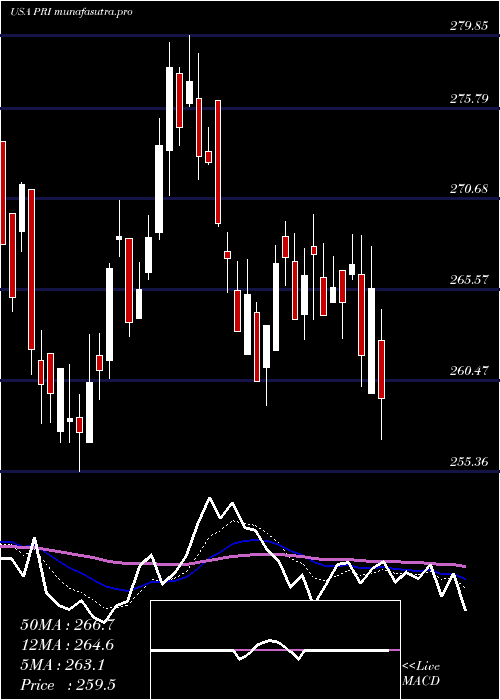
Daily price and charts and targets PrimericaInc Strong Daily Stock price targets for PrimericaInc PRI are 260.57 and 263.93 | Daily Target 1 | 260 | | Daily Target 2 | 261.13 | | Daily Target 3 | 263.36333333333 | | Daily Target 4 | 264.49 | | Daily Target 5 | 266.72 |
Daily price and volume Primerica Inc
| Date |
Closing |
Open |
Range |
Volume |
Mon 20 October 2025 |
262.25 (-0.69%) |
265.23 |
262.24 - 265.60 |
0.6628 times |
Fri 17 October 2025 |
264.08 (2.2%) |
258.74 |
258.74 - 264.26 |
1.1735 times |
Thu 16 October 2025 |
258.40 (-3.52%) |
265.53 |
258.02 - 268.34 |
1.7356 times |
Wed 15 October 2025 |
267.82 (-1.59%) |
271.20 |
267.22 - 273.37 |
0.8461 times |
Tue 14 October 2025 |
272.14 (2.09%) |
265.57 |
265.57 - 272.83 |
0.6853 times |
Mon 13 October 2025 |
266.58 (0.12%) |
266.82 |
264.92 - 268.62 |
0.8287 times |
Fri 10 October 2025 |
266.26 (-1.05%) |
271.49 |
264.15 - 271.49 |
1.2677 times |
Thu 09 October 2025 |
269.08 (-0.27%) |
270.90 |
267.25 - 271.92 |
0.933 times |
Wed 08 October 2025 |
269.82 (-1.15%) |
273.63 |
268.75 - 275.50 |
0.849 times |
Tue 07 October 2025 |
272.95 (-1.61%) |
279.04 |
271.75 - 280.71 |
1.0185 times |
Mon 06 October 2025 |
277.43 (-0.56%) |
279.76 |
276.36 - 281.20 |
0.5644 times |
Weekly price and charts PrimericaInc Strong weekly Stock price targets for PrimericaInc PRI are 260.57 and 263.93 | Weekly Target 1 | 260 | | Weekly Target 2 | 261.13 | | Weekly Target 3 | 263.36333333333 | | Weekly Target 4 | 264.49 | | Weekly Target 5 | 266.72 |
Weekly price and volumes for Primerica Inc
| Date |
Closing |
Open |
Range |
Volume |
Mon 20 October 2025 |
262.25 (-0.69%) |
265.23 |
262.24 - 265.60 |
0.1276 times |
Fri 17 October 2025 |
264.08 (-0.82%) |
266.82 |
258.02 - 273.37 |
1.0143 times |
Fri 10 October 2025 |
266.26 (-4.56%) |
279.76 |
264.15 - 281.20 |
0.8917 times |
Fri 03 October 2025 |
278.99 (0.55%) |
278.07 |
273.24 - 281.70 |
0.8802 times |
Fri 26 September 2025 |
277.46 (0.75%) |
272.94 |
269.88 - 288.03 |
1.5069 times |
Fri 19 September 2025 |
275.39 (0.42%) |
273.79 |
266.64 - 276.41 |
1.7912 times |
Fri 12 September 2025 |
274.23 (0.36%) |
272.24 |
267.62 - 278.14 |
1.4319 times |
Fri 05 September 2025 |
273.25 (1.45%) |
267.40 |
264.11 - 275.60 |
1.1279 times |
Fri 29 August 2025 |
269.34 (0%) |
268.22 |
268.08 - 270.94 |
0.2192 times |
Fri 29 August 2025 |
269.34 (-0.19%) |
268.66 |
264.80 - 271.51 |
1.009 times |
Fri 22 August 2025 |
269.85 (3.13%) |
260.00 |
258.93 - 271.04 |
1.0649 times |

Monthly price and charts PrimericaInc Strong monthly Stock price targets for PrimericaInc PRI are 248.3 and 271.98 | Monthly Target 1 | 243.64 | | Monthly Target 2 | 252.95 | | Monthly Target 3 | 267.32333333333 | | Monthly Target 4 | 276.63 | | Monthly Target 5 | 291 |
Monthly price and volumes Primerica Inc
| Date |
Closing |
Open |
Range |
Volume |
Mon 20 October 2025 |
262.25 (-5.53%) |
276.34 |
258.02 - 281.70 |
0.5393 times |
Tue 30 September 2025 |
277.59 (3.06%) |
267.40 |
264.11 - 288.03 |
1.3225 times |
Fri 29 August 2025 |
269.34 (1.4%) |
262.71 |
255.46 - 272.32 |
0.9626 times |
Thu 31 July 2025 |
265.63 (-2.94%) |
273.39 |
259.08 - 279.85 |
1.1043 times |
Mon 30 June 2025 |
273.67 (1.13%) |
268.82 |
255.36 - 275.20 |
1.1164 times |
Fri 30 May 2025 |
270.60 (3.25%) |
260.96 |
257.30 - 281.74 |
0.9743 times |
Wed 30 April 2025 |
262.07 (-7.89%) |
284.78 |
230.98 - 291.65 |
1.1618 times |
Mon 31 March 2025 |
284.53 (-1.89%) |
290.74 |
273.98 - 296.00 |
1.1158 times |
Fri 28 February 2025 |
290.00 (-0.06%) |
284.85 |
270.67 - 298.75 |
0.8212 times |
Fri 31 January 2025 |
290.17 (6.91%) |
272.05 |
268.53 - 296.00 |
0.8818 times |
Tue 31 December 2024 |
271.42 (-10.99%) |
294.99 |
264.95 - 294.99 |
0.9087 times |

DMA SMA EMA moving averages of Primerica Inc PRI
DMA (daily moving average) of Primerica Inc PRI
| DMA period | DMA value | | 5 day DMA | 264.94 | | 12 day DMA | 268.82 | | 20 day DMA | 272.26 | | 35 day DMA | 272.05 | | 50 day DMA | 270.37 | | 100 day DMA | 268.12 | | 150 day DMA | 268.02 | | 200 day DMA | 272.2 | EMA (exponential moving average) of Primerica Inc PRI
| EMA period | EMA current | EMA prev | EMA prev2 | | 5 day EMA | 264.18 | 265.15 | 265.69 | | 12 day EMA | 267.55 | 268.51 | 269.32 | | 20 day EMA | 269.31 | 270.05 | 270.68 | | 35 day EMA | 269.63 | 270.06 | 270.41 | | 50 day EMA | 268.99 | 269.27 | 269.48 |
SMA (simple moving average) of Primerica Inc PRI
| SMA period | SMA current | SMA prev | SMA prev2 | | 5 day SMA | 264.94 | 265.8 | 266.24 | | 12 day SMA | 268.82 | 270.16 | 271.21 | | 20 day SMA | 272.26 | 272.76 | 273.33 | | 35 day SMA | 272.05 | 272.26 | 272.41 | | 50 day SMA | 270.37 | 270.29 | 270.16 | | 100 day SMA | 268.12 | 268.22 | 268.25 | | 150 day SMA | 268.02 | 268.21 | 268.35 | | 200 day SMA | 272.2 | 272.27 | 272.31 |
|
|
