PraGroup PRAA full analysis,charts,indicators,moving averages,SMA,DMA,EMA,ADX,MACD,RSIPra Group PRAA WideScreen charts, DMA,SMA,EMA technical analysis, forecast prediction, by indicators ADX,MACD,RSI,CCI USA stock exchange
operates under Finance sector & deals in Finance Consumer Services
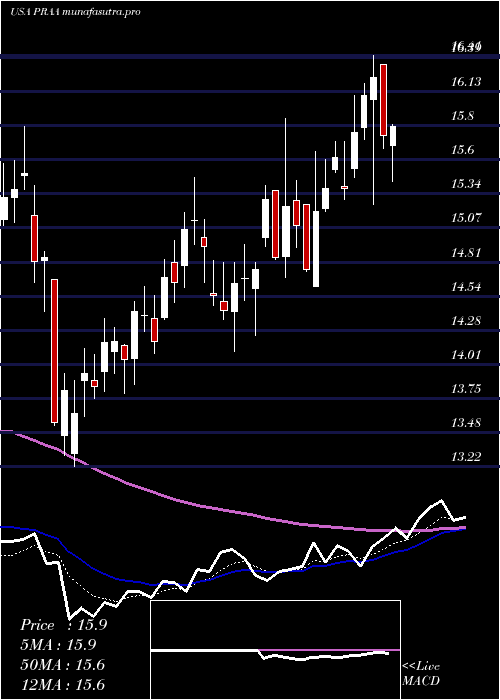
Daily price and charts and targets PraGroup Strong Daily Stock price targets for PraGroup PRAA are 13.87 and 14.35 | Daily Target 1 | 13.49 | | Daily Target 2 | 13.76 | | Daily Target 3 | 13.97 | | Daily Target 4 | 14.24 | | Daily Target 5 | 14.45 |
Daily price and volume Pra Group
| Date |
Closing |
Open |
Range |
Volume |
Tue 21 October 2025 |
14.03 (2.04%) |
13.75 |
13.70 - 14.18 |
0.763 times |
Mon 20 October 2025 |
13.75 (1.63%) |
13.68 |
13.49 - 13.81 |
1.1644 times |
Fri 17 October 2025 |
13.53 (1.5%) |
13.27 |
13.27 - 13.67 |
0.9243 times |
Thu 16 October 2025 |
13.33 (-4.44%) |
14.08 |
13.25 - 14.19 |
0.9106 times |
Wed 15 October 2025 |
13.95 (-2.52%) |
14.49 |
13.94 - 14.60 |
0.8984 times |
Tue 14 October 2025 |
14.31 (5.14%) |
13.44 |
13.44 - 14.44 |
1.8087 times |
Mon 13 October 2025 |
13.61 (1.64%) |
13.55 |
13.37 - 13.73 |
0.8827 times |
Fri 10 October 2025 |
13.39 (-2.48%) |
13.76 |
13.37 - 14.00 |
0.9523 times |
Thu 09 October 2025 |
13.73 (-1.51%) |
13.89 |
13.62 - 13.95 |
0.7752 times |
Wed 08 October 2025 |
13.94 (0.43%) |
13.90 |
13.82 - 14.23 |
0.9205 times |
Tue 07 October 2025 |
13.88 (-3.61%) |
14.10 |
13.79 - 14.20 |
0.9669 times |
Weekly price and charts PraGroup Strong weekly Stock price targets for PraGroup PRAA are 13.76 and 14.45 | Weekly Target 1 | 13.21 | | Weekly Target 2 | 13.62 | | Weekly Target 3 | 13.9 | | Weekly Target 4 | 14.31 | | Weekly Target 5 | 14.59 |
Weekly price and volumes for Pra Group
| Date |
Closing |
Open |
Range |
Volume |
Tue 21 October 2025 |
14.03 (3.7%) |
13.68 |
13.49 - 14.18 |
0.4819 times |
Fri 17 October 2025 |
13.53 (1.05%) |
13.55 |
13.25 - 14.60 |
1.3562 times |
Fri 10 October 2025 |
13.39 (-9.83%) |
14.97 |
13.37 - 15.36 |
1.1624 times |
Fri 03 October 2025 |
14.85 (-7.42%) |
16.17 |
14.79 - 16.21 |
1.1918 times |
Fri 26 September 2025 |
16.04 (-3.26%) |
16.53 |
15.54 - 17.06 |
1.3287 times |
Fri 19 September 2025 |
16.58 (-1.43%) |
16.89 |
16.41 - 17.46 |
2.0789 times |
Fri 12 September 2025 |
16.82 (-2.1%) |
17.25 |
16.57 - 17.40 |
0.8525 times |
Fri 05 September 2025 |
17.18 (0.53%) |
16.81 |
16.64 - 17.45 |
0.5706 times |
Fri 29 August 2025 |
17.09 (0%) |
16.95 |
16.88 - 17.15 |
0.1394 times |
Fri 29 August 2025 |
17.09 (-1.44%) |
17.22 |
16.84 - 17.39 |
0.8376 times |
Fri 22 August 2025 |
17.34 (7.04%) |
16.14 |
15.97 - 17.49 |
1.0188 times |
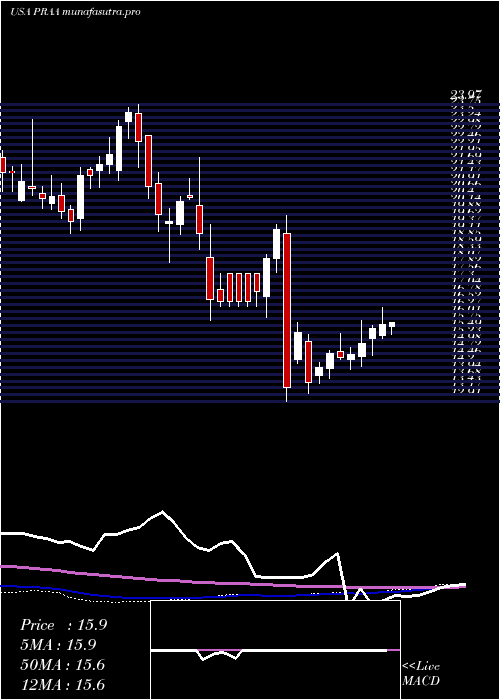
Monthly price and charts PraGroup Strong monthly Stock price targets for PraGroup PRAA are 12.48 and 14.81 | Monthly Target 1 | 11.96 | | Monthly Target 2 | 12.99 | | Monthly Target 3 | 14.286666666667 | | Monthly Target 4 | 15.32 | | Monthly Target 5 | 16.62 |
Monthly price and volumes Pra Group
| Date |
Closing |
Open |
Range |
Volume |
Tue 21 October 2025 |
14.03 (-9.13%) |
15.37 |
13.25 - 15.58 |
0.5884 times |
Tue 30 September 2025 |
15.44 (-9.65%) |
16.81 |
14.93 - 17.46 |
0.879 times |
Fri 29 August 2025 |
17.09 (12.43%) |
14.80 |
14.55 - 18.57 |
0.8476 times |
Thu 31 July 2025 |
15.20 (3.05%) |
14.62 |
14.62 - 16.49 |
0.8745 times |
Mon 30 June 2025 |
14.75 (3.95%) |
14.16 |
13.79 - 15.92 |
1.4235 times |
Fri 30 May 2025 |
14.19 (-22.46%) |
18.33 |
12.91 - 19.83 |
2.1127 times |
Wed 30 April 2025 |
18.30 (-11.25%) |
20.53 |
15.94 - 22.01 |
0.9312 times |
Mon 31 March 2025 |
20.62 (-1.48%) |
21.01 |
18.09 - 21.45 |
0.989 times |
Fri 28 February 2025 |
20.93 (-5.34%) |
21.51 |
20.46 - 23.97 |
0.6541 times |
Fri 31 January 2025 |
22.11 (5.84%) |
21.06 |
19.17 - 22.74 |
0.7001 times |
Tue 31 December 2024 |
20.89 (-2.57%) |
20.41 |
20.05 - 23.42 |
0.7534 times |

DMA SMA EMA moving averages of Pra Group PRAA
DMA (daily moving average) of Pra Group PRAA
| DMA period | DMA value | | 5 day DMA | 13.72 | | 12 day DMA | 13.82 | | 20 day DMA | 14.51 | | 35 day DMA | 15.52 | | 50 day DMA | 15.89 | | 100 day DMA | 15.57 | | 150 day DMA | 16.09 | | 200 day DMA | 17.4 | EMA (exponential moving average) of Pra Group PRAA
| EMA period | EMA current | EMA prev | EMA prev2 | | 5 day EMA | 13.81 | 13.7 | 13.68 | | 12 day EMA | 14.05 | 14.05 | 14.11 | | 20 day EMA | 14.46 | 14.51 | 14.59 | | 35 day EMA | 15.03 | 15.09 | 15.17 | | 50 day EMA | 15.66 | 15.73 | 15.81 |
SMA (simple moving average) of Pra Group PRAA
| SMA period | SMA current | SMA prev | SMA prev2 | | 5 day SMA | 13.72 | 13.77 | 13.75 | | 12 day SMA | 13.82 | 13.89 | 14 | | 20 day SMA | 14.51 | 14.63 | 14.78 | | 35 day SMA | 15.52 | 15.6 | 15.7 | | 50 day SMA | 15.89 | 15.94 | 15.97 | | 100 day SMA | 15.57 | 15.57 | 15.57 | | 150 day SMA | 16.09 | 16.13 | 16.17 | | 200 day SMA | 17.4 | 17.44 | 17.47 |
|
|
