PutnamPremier PPT full analysis,charts,indicators,moving averages,SMA,DMA,EMA,ADX,MACD,RSIPutnam Premier PPT WideScreen charts, DMA,SMA,EMA technical analysis, forecast prediction, by indicators ADX,MACD,RSI,CCI USA stock exchange
operates under N A sector & deals in N A
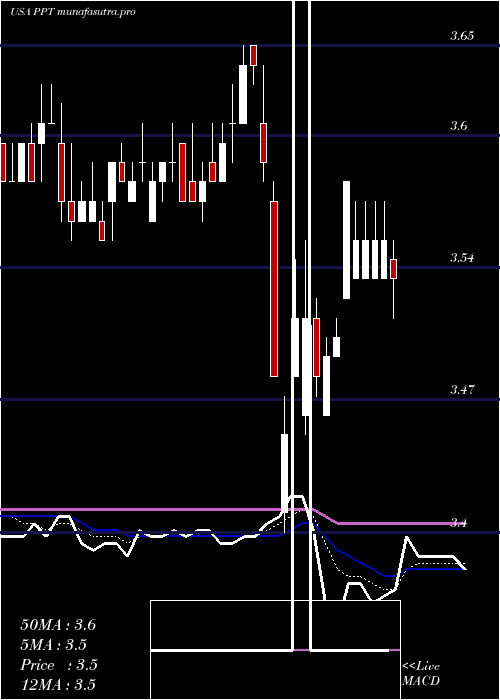
Daily price and charts and targets PutnamPremier Strong Daily Stock price targets for PutnamPremier PPT are 3.62 and 3.65 | Daily Target 1 | 3.6 | | Daily Target 2 | 3.62 | | Daily Target 3 | 3.6333333333333 | | Daily Target 4 | 3.65 | | Daily Target 5 | 3.66 |
Daily price and volume Putnam Premier
| Date |
Closing |
Open |
Range |
Volume |
Wed 22 October 2025 |
3.63 (-0.27%) |
3.63 |
3.62 - 3.65 |
0.6384 times |
Tue 21 October 2025 |
3.64 (-0.27%) |
3.67 |
3.63 - 3.67 |
2.1058 times |
Mon 20 October 2025 |
3.65 (1.11%) |
3.61 |
3.61 - 3.65 |
1.709 times |
Fri 17 October 2025 |
3.61 (-1.63%) |
3.64 |
3.60 - 3.65 |
1.1984 times |
Thu 16 October 2025 |
3.67 (-0.54%) |
3.69 |
3.66 - 3.69 |
0.5616 times |
Wed 15 October 2025 |
3.69 (0.27%) |
3.68 |
3.67 - 3.69 |
0.2867 times |
Tue 14 October 2025 |
3.68 (0%) |
3.68 |
3.67 - 3.70 |
0.5332 times |
Mon 13 October 2025 |
3.68 (-1.08%) |
3.69 |
3.67 - 3.70 |
0.8677 times |
Tue 07 October 2025 |
3.72 (0.81%) |
3.69 |
3.69 - 3.74 |
1.3735 times |
Mon 06 October 2025 |
3.69 (0.82%) |
3.68 |
3.66 - 3.71 |
0.7256 times |
Fri 03 October 2025 |
3.66 (-0.81%) |
3.70 |
3.66 - 3.70 |
2.7577 times |
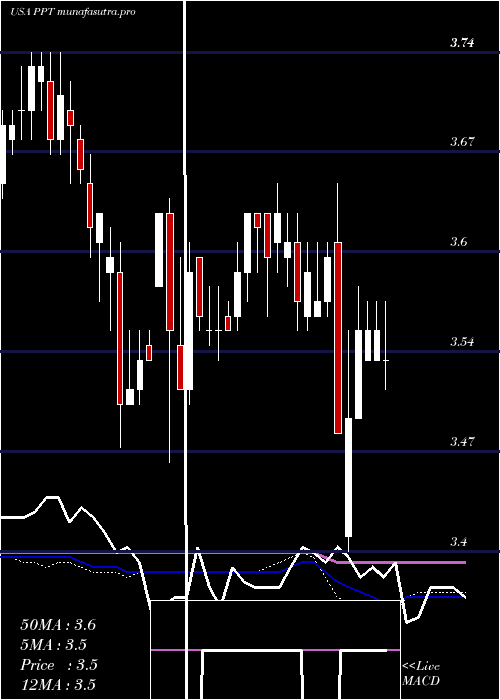
Weekly price and charts PutnamPremier Strong weekly Stock price targets for PutnamPremier PPT are 3.62 and 3.68 | Weekly Target 1 | 3.58 | | Weekly Target 2 | 3.6 | | Weekly Target 3 | 3.6366666666667 | | Weekly Target 4 | 3.66 | | Weekly Target 5 | 3.7 |
Weekly price and volumes for Putnam Premier
| Date |
Closing |
Open |
Range |
Volume |
Wed 22 October 2025 |
3.63 (0.55%) |
3.61 |
3.61 - 3.67 |
0.913 times |
Fri 17 October 2025 |
3.61 (-2.96%) |
3.69 |
3.60 - 3.70 |
0.7068 times |
Tue 07 October 2025 |
3.72 (1.64%) |
3.68 |
3.66 - 3.74 |
0.4304 times |
Fri 03 October 2025 |
3.66 (-0.27%) |
3.68 |
3.64 - 3.73 |
1.9475 times |
Fri 26 September 2025 |
3.67 (-1.34%) |
3.73 |
3.66 - 3.74 |
0.9177 times |
Fri 19 September 2025 |
3.72 (0%) |
3.73 |
3.70 - 3.77 |
1.0756 times |
Fri 12 September 2025 |
3.72 (0.54%) |
3.71 |
3.68 - 3.75 |
1.4309 times |
Fri 05 September 2025 |
3.70 (0.27%) |
3.69 |
3.68 - 3.72 |
0.8825 times |
Fri 29 August 2025 |
3.69 (0%) |
3.71 |
3.69 - 3.72 |
0.2424 times |
Fri 29 August 2025 |
3.69 (0.82%) |
3.67 |
3.66 - 3.73 |
1.4532 times |
Fri 22 August 2025 |
3.66 (-0.81%) |
3.67 |
3.64 - 3.70 |
0.8782 times |
Monthly price and charts PutnamPremier Strong monthly Stock price targets for PutnamPremier PPT are 3.55 and 3.69 | Monthly Target 1 | 3.52 | | Monthly Target 2 | 3.57 | | Monthly Target 3 | 3.6566666666667 | | Monthly Target 4 | 3.71 | | Monthly Target 5 | 3.8 |
Monthly price and volumes Putnam Premier
| Date |
Closing |
Open |
Range |
Volume |
Wed 22 October 2025 |
3.63 (-1.63%) |
3.68 |
3.60 - 3.74 |
0.7093 times |
Tue 30 September 2025 |
3.69 (0%) |
3.69 |
3.64 - 3.77 |
1.24 times |
Fri 29 August 2025 |
3.69 (0.82%) |
3.67 |
3.64 - 3.73 |
0.9757 times |
Thu 31 July 2025 |
3.66 (-0.27%) |
3.67 |
3.59 - 3.71 |
1.2663 times |
Mon 30 June 2025 |
3.67 (-1.08%) |
3.70 |
3.62 - 3.72 |
0.9554 times |
Fri 30 May 2025 |
3.71 (2.49%) |
3.64 |
3.57 - 3.73 |
1.0483 times |
Wed 30 April 2025 |
3.62 (0.28%) |
3.61 |
3.40 - 3.65 |
1.1698 times |
Mon 31 March 2025 |
3.61 (0%) |
3.61 |
3.55 - 3.63 |
0.9789 times |
Fri 28 February 2025 |
3.61 (-0.55%) |
3.63 |
3.56 - 3.65 |
0.8265 times |
Fri 31 January 2025 |
3.63 (1.97%) |
3.59 |
3.53 - 3.63 |
0.8299 times |
Tue 31 December 2024 |
3.56 (0.85%) |
3.58 |
3.46 - 3.64 |
1.055 times |

DMA SMA EMA moving averages of Putnam Premier PPT
DMA (daily moving average) of Putnam Premier PPT
| DMA period | DMA value | | 5 day DMA | 3.64 | | 12 day DMA | 3.67 | | 20 day DMA | 3.68 | | 35 day DMA | 3.69 | | 50 day DMA | 3.69 | | 100 day DMA | 3.68 | | 150 day DMA | 3.65 | | 200 day DMA | 3.63 | EMA (exponential moving average) of Putnam Premier PPT
| EMA period | EMA current | EMA prev | EMA prev2 | | 5 day EMA | 3.64 | 3.65 | 3.66 | | 12 day EMA | 3.66 | 3.67 | 3.68 | | 20 day EMA | 3.68 | 3.69 | 3.69 | | 35 day EMA | 3.69 | 3.69 | 3.69 | | 50 day EMA | 3.69 | 3.69 | 3.69 |
SMA (simple moving average) of Putnam Premier PPT
| SMA period | SMA current | SMA prev | SMA prev2 | | 5 day SMA | 3.64 | 3.65 | 3.66 | | 12 day SMA | 3.67 | 3.67 | 3.68 | | 20 day SMA | 3.68 | 3.68 | 3.69 | | 35 day SMA | 3.69 | 3.7 | 3.7 | | 50 day SMA | 3.69 | 3.69 | 3.69 | | 100 day SMA | 3.68 | 3.68 | 3.68 | | 150 day SMA | 3.65 | 3.65 | 3.65 | | 200 day SMA | 3.63 | 3.63 | 3.63 |
|
|
