PplCorporation PPL full analysis,charts,indicators,moving averages,SMA,DMA,EMA,ADX,MACD,RSIPpl Corporation PPL WideScreen charts, DMA,SMA,EMA technical analysis, forecast prediction, by indicators ADX,MACD,RSI,CCI USA stock exchange
operates under Public Utilities sector & deals in Electric Utilities Central
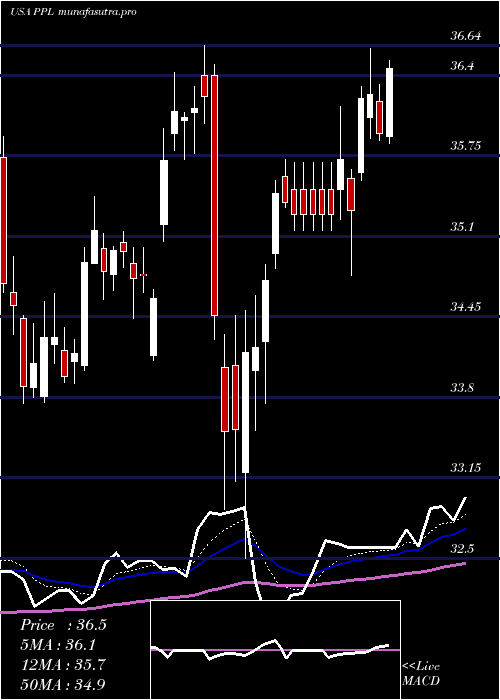
Daily price and charts and targets PplCorporation Strong Daily Stock price targets for PplCorporation PPL are 36.86 and 37.88 | Daily Target 1 | 36.63 | | Daily Target 2 | 37.08 | | Daily Target 3 | 37.653333333333 | | Daily Target 4 | 38.1 | | Daily Target 5 | 38.67 |
Daily price and volume Ppl Corporation
| Date |
Closing |
Open |
Range |
Volume |
Tue 21 October 2025 |
37.52 (-0.4%) |
38.12 |
37.21 - 38.23 |
1.4009 times |
Mon 20 October 2025 |
37.67 (0.61%) |
37.45 |
37.44 - 37.85 |
1.0742 times |
Fri 17 October 2025 |
37.44 (0.35%) |
37.44 |
36.85 - 37.55 |
1.3697 times |
Thu 16 October 2025 |
37.31 (-1.74%) |
37.98 |
37.28 - 38.26 |
0.9209 times |
Wed 15 October 2025 |
37.97 (0.29%) |
37.96 |
37.83 - 38.23 |
0.9946 times |
Tue 14 October 2025 |
37.86 (1.12%) |
37.56 |
37.44 - 37.96 |
0.7149 times |
Mon 13 October 2025 |
37.44 (-0.13%) |
37.05 |
37.01 - 37.54 |
0.6413 times |
Tue 07 October 2025 |
37.49 (0.92%) |
37.41 |
37.29 - 37.81 |
1.0862 times |
Mon 06 October 2025 |
37.15 (0.68%) |
36.66 |
36.62 - 37.34 |
0.7951 times |
Fri 03 October 2025 |
36.90 (1.37%) |
36.47 |
36.44 - 36.91 |
1.0022 times |
Thu 02 October 2025 |
36.40 (-0.52%) |
36.59 |
36.28 - 36.65 |
0.7825 times |
Weekly price and charts PplCorporation Strong weekly Stock price targets for PplCorporation PPL are 37.37 and 38.39 | Weekly Target 1 | 36.63 | | Weekly Target 2 | 37.08 | | Weekly Target 3 | 37.653333333333 | | Weekly Target 4 | 38.1 | | Weekly Target 5 | 38.67 |
Weekly price and volumes for Ppl Corporation
| Date |
Closing |
Open |
Range |
Volume |
Tue 21 October 2025 |
37.52 (0.21%) |
37.45 |
37.21 - 38.23 |
0.7243 times |
Fri 17 October 2025 |
37.44 (-0.13%) |
37.05 |
36.85 - 38.26 |
1.3582 times |
Tue 07 October 2025 |
37.49 (1.6%) |
36.66 |
36.62 - 37.81 |
0.5505 times |
Fri 03 October 2025 |
36.90 (0.49%) |
36.79 |
36.28 - 37.31 |
1.4195 times |
Fri 26 September 2025 |
36.72 (2.89%) |
35.74 |
35.52 - 36.76 |
1.0506 times |
Fri 19 September 2025 |
35.69 (-1.3%) |
36.13 |
35.21 - 36.24 |
1.1679 times |
Fri 12 September 2025 |
36.16 (0.56%) |
35.91 |
35.30 - 36.25 |
0.9874 times |
Fri 05 September 2025 |
35.96 (-1.4%) |
36.33 |
35.87 - 36.72 |
1.1495 times |
Fri 29 August 2025 |
36.47 (0%) |
36.62 |
36.41 - 36.68 |
0.3421 times |
Fri 29 August 2025 |
36.47 (-1.17%) |
36.78 |
36.25 - 36.90 |
1.2502 times |
Fri 22 August 2025 |
36.90 (0.96%) |
36.60 |
36.20 - 37.38 |
1.406 times |
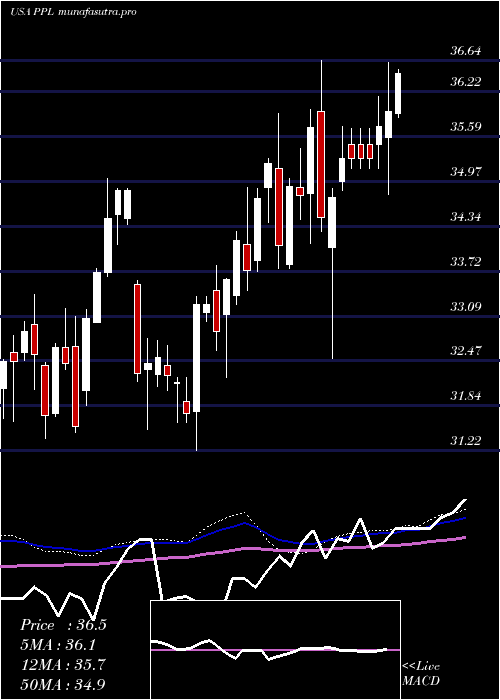
Monthly price and charts PplCorporation Strong monthly Stock price targets for PplCorporation PPL are 36.9 and 38.88 | Monthly Target 1 | 35.37 | | Monthly Target 2 | 36.45 | | Monthly Target 3 | 37.353333333333 | | Monthly Target 4 | 38.43 | | Monthly Target 5 | 39.33 |
Monthly price and volumes Ppl Corporation
| Date |
Closing |
Open |
Range |
Volume |
Tue 21 October 2025 |
37.52 (0.97%) |
37.12 |
36.28 - 38.26 |
0.6239 times |
Tue 30 September 2025 |
37.16 (1.89%) |
36.33 |
35.21 - 37.31 |
0.8903 times |
Fri 29 August 2025 |
36.47 (2.19%) |
35.82 |
35.50 - 37.38 |
1.3952 times |
Thu 31 July 2025 |
35.69 (5.31%) |
33.91 |
33.21 - 36.99 |
1.3161 times |
Mon 30 June 2025 |
33.89 (-2.47%) |
34.49 |
33.29 - 34.79 |
0.8103 times |
Fri 30 May 2025 |
34.75 (-4.79%) |
36.46 |
33.12 - 36.62 |
1.0911 times |
Wed 30 April 2025 |
36.50 (1.08%) |
36.04 |
32.50 - 36.70 |
1.0519 times |
Mon 31 March 2025 |
36.11 (2.56%) |
35.15 |
33.75 - 36.42 |
1.0444 times |
Fri 28 February 2025 |
35.21 (4.79%) |
33.38 |
33.26 - 35.28 |
0.8956 times |
Fri 31 January 2025 |
33.60 (3.51%) |
32.58 |
31.22 - 33.79 |
0.881 times |
Tue 31 December 2024 |
32.46 (-6.83%) |
33.53 |
31.52 - 33.58 |
0.575 times |

DMA SMA EMA moving averages of Ppl Corporation PPL
DMA (daily moving average) of Ppl Corporation PPL
| DMA period | DMA value | | 5 day DMA | 37.58 | | 12 day DMA | 37.31 | | 20 day DMA | 36.95 | | 35 day DMA | 36.54 | | 50 day DMA | 36.59 | | 100 day DMA | 35.65 | | 150 day DMA | 35.52 | | 200 day DMA | 35.04 | EMA (exponential moving average) of Ppl Corporation PPL
| EMA period | EMA current | EMA prev | EMA prev2 | | 5 day EMA | 37.53 | 37.54 | 37.48 | | 12 day EMA | 37.33 | 37.29 | 37.22 | | 20 day EMA | 37.08 | 37.03 | 36.96 | | 35 day EMA | 36.86 | 36.82 | 36.77 | | 50 day EMA | 36.63 | 36.59 | 36.55 |
SMA (simple moving average) of Ppl Corporation PPL
| SMA period | SMA current | SMA prev | SMA prev2 | | 5 day SMA | 37.58 | 37.65 | 37.6 | | 12 day SMA | 37.31 | 37.28 | 37.23 | | 20 day SMA | 36.95 | 36.86 | 36.75 | | 35 day SMA | 36.54 | 36.52 | 36.49 | | 50 day SMA | 36.59 | 36.56 | 36.53 | | 100 day SMA | 35.65 | 35.62 | 35.59 | | 150 day SMA | 35.52 | 35.49 | 35.47 | | 200 day SMA | 35.04 | 35.01 | 34.99 |
|
|
