PermaPipe PPIH full analysis,charts,indicators,moving averages,SMA,DMA,EMA,ADX,MACD,RSIPerma Pipe PPIH WideScreen charts, DMA,SMA,EMA technical analysis, forecast prediction, by indicators ADX,MACD,RSI,CCI USA stock exchange
operates under Capital Goods sector & deals in Pollution Control Equipment
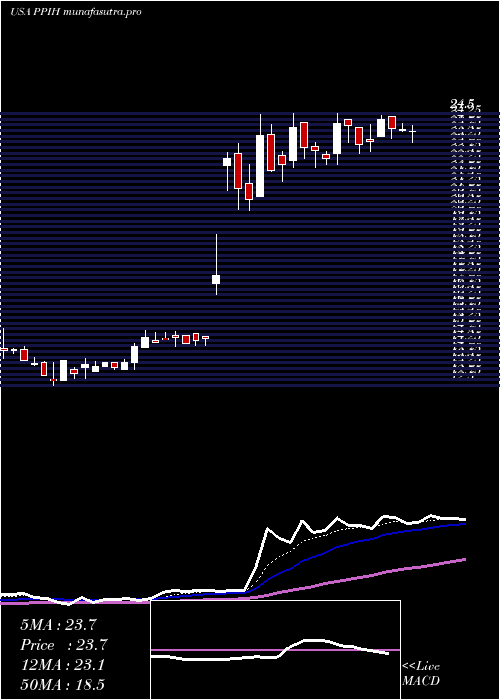
Daily price and charts and targets PermaPipe Strong Daily Stock price targets for PermaPipe PPIH are 27.65 and 28.95 | Daily Target 1 | 27.37 | | Daily Target 2 | 27.93 | | Daily Target 3 | 28.673333333333 | | Daily Target 4 | 29.23 | | Daily Target 5 | 29.97 |
Daily price and volume Perma Pipe
| Date |
Closing |
Open |
Range |
Volume |
Thu 04 December 2025 |
28.48 (-3.03%) |
29.15 |
28.12 - 29.42 |
0.9351 times |
Wed 03 December 2025 |
29.37 (14.77%) |
26.75 |
26.75 - 29.80 |
2.3529 times |
Tue 02 December 2025 |
25.59 (2.81%) |
25.12 |
25.12 - 26.10 |
0.6463 times |
Mon 01 December 2025 |
24.89 (-3.15%) |
25.22 |
24.71 - 25.36 |
0.484 times |
Fri 28 November 2025 |
25.70 (0.67%) |
25.88 |
25.36 - 25.88 |
0.3383 times |
Wed 26 November 2025 |
25.53 (2.04%) |
25.36 |
25.05 - 25.90 |
0.7935 times |
Tue 25 November 2025 |
25.02 (2.21%) |
24.72 |
24.50 - 25.41 |
0.4854 times |
Mon 24 November 2025 |
24.48 (1.87%) |
24.25 |
23.64 - 24.80 |
0.8443 times |
Fri 21 November 2025 |
24.03 (4.39%) |
24.00 |
23.17 - 24.23 |
1.9417 times |
Thu 20 November 2025 |
23.02 (-1.24%) |
24.15 |
23.01 - 25.22 |
1.1785 times |
Wed 19 November 2025 |
23.31 (-0.64%) |
23.48 |
23.20 - 24.00 |
0.6793 times |
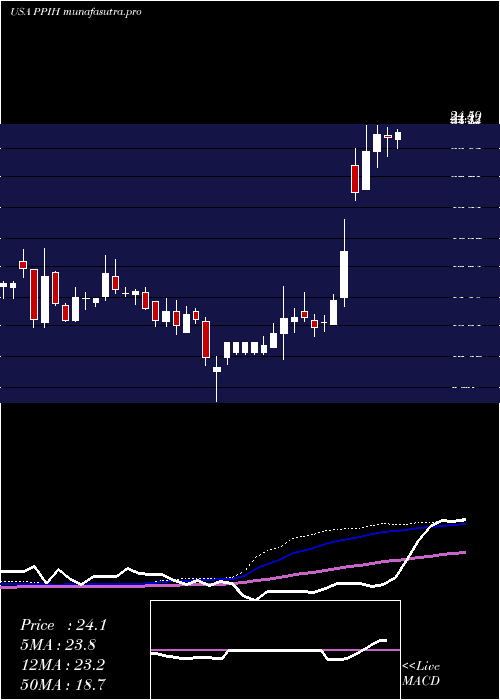
Weekly price and charts PermaPipe Strong weekly Stock price targets for PermaPipe PPIH are 26.6 and 31.69 | Weekly Target 1 | 22.57 | | Weekly Target 2 | 25.53 | | Weekly Target 3 | 27.663333333333 | | Weekly Target 4 | 30.62 | | Weekly Target 5 | 32.75 |
Weekly price and volumes for Perma Pipe
| Date |
Closing |
Open |
Range |
Volume |
Thu 04 December 2025 |
28.48 (10.82%) |
25.22 |
24.71 - 29.80 |
0.8167 times |
Fri 28 November 2025 |
25.70 (6.95%) |
24.25 |
23.64 - 25.90 |
0.455 times |
Fri 21 November 2025 |
24.03 (-0.87%) |
24.00 |
23.01 - 25.22 |
0.9382 times |
Fri 14 November 2025 |
24.24 (-12.81%) |
28.58 |
24.10 - 28.94 |
1.212 times |
Fri 07 November 2025 |
27.80 (0.29%) |
27.52 |
26.34 - 28.89 |
0.7103 times |
Fri 31 October 2025 |
27.72 (0%) |
27.05 |
27.04 - 28.21 |
0.1789 times |
Fri 31 October 2025 |
27.72 (-3.65%) |
29.09 |
26.27 - 29.89 |
0.7415 times |
Fri 24 October 2025 |
28.77 (16.48%) |
24.73 |
24.73 - 29.94 |
1.2297 times |
Fri 17 October 2025 |
24.70 (-1.71%) |
26.48 |
24.04 - 27.47 |
1.3187 times |
Fri 10 October 2025 |
25.13 (11.99%) |
22.39 |
22.13 - 27.75 |
2.399 times |
Fri 03 October 2025 |
22.44 (-2.26%) |
23.08 |
22.29 - 23.99 |
1.2781 times |
Monthly price and charts PermaPipe Strong monthly Stock price targets for PermaPipe PPIH are 26.6 and 31.69 | Monthly Target 1 | 22.57 | | Monthly Target 2 | 25.53 | | Monthly Target 3 | 27.663333333333 | | Monthly Target 4 | 30.62 | | Monthly Target 5 | 32.75 |
Monthly price and volumes Perma Pipe
| Date |
Closing |
Open |
Range |
Volume |
Thu 04 December 2025 |
28.48 (10.82%) |
25.22 |
24.71 - 29.80 |
0.2045 times |
Fri 28 November 2025 |
25.70 (-7.29%) |
27.52 |
23.01 - 28.94 |
0.83 times |
Fri 31 October 2025 |
27.72 (18.31%) |
23.15 |
22.13 - 29.94 |
1.6871 times |
Tue 30 September 2025 |
23.43 (-21.35%) |
29.66 |
21.96 - 33.09 |
3.3464 times |
Fri 29 August 2025 |
29.79 (34.43%) |
22.08 |
20.92 - 32.90 |
1.5466 times |
Thu 31 July 2025 |
22.16 (-3.1%) |
22.68 |
21.82 - 25.65 |
0.5987 times |
Mon 30 June 2025 |
22.87 (72.08%) |
13.20 |
13.20 - 24.50 |
0.6542 times |
Fri 30 May 2025 |
13.29 (10.75%) |
12.09 |
11.22 - 15.31 |
0.3436 times |
Wed 30 April 2025 |
12.00 (-3.46%) |
12.01 |
8.81 - 13.21 |
0.535 times |
Mon 31 March 2025 |
12.43 (-7.31%) |
13.37 |
12.35 - 14.68 |
0.2541 times |
Fri 28 February 2025 |
13.41 (-11.72%) |
14.93 |
13.06 - 15.28 |
0.2319 times |
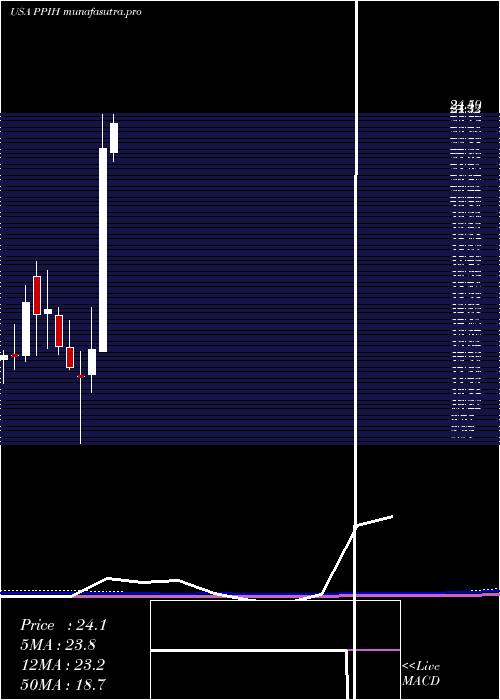
DMA SMA EMA moving averages of Perma Pipe PPIH
DMA (daily moving average) of Perma Pipe PPIH
| DMA period | DMA value | | 5 day DMA | 26.81 | | 12 day DMA | 25.24 | | 20 day DMA | 25.77 | | 35 day DMA | 26.47 | | 50 day DMA | 25.77 | | 100 day DMA | 26.19 | | 150 day DMA | 23.22 | | 200 day DMA | 20.59 | EMA (exponential moving average) of Perma Pipe PPIH
| EMA period | EMA current | EMA prev | EMA prev2 | | 5 day EMA | 27.23 | 26.6 | 25.21 | | 12 day EMA | 26.22 | 25.81 | 25.16 | | 20 day EMA | 26.01 | 25.75 | 25.37 | | 35 day EMA | 25.68 | 25.51 | 25.28 | | 50 day EMA | 25.68 | 25.57 | 25.41 |
SMA (simple moving average) of Perma Pipe PPIH
| SMA period | SMA current | SMA prev | SMA prev2 | | 5 day SMA | 26.81 | 26.22 | 25.35 | | 12 day SMA | 25.24 | 24.83 | 24.41 | | 20 day SMA | 25.77 | 25.76 | 25.67 | | 35 day SMA | 26.47 | 26.42 | 26.3 | | 50 day SMA | 25.77 | 25.67 | 25.54 | | 100 day SMA | 26.19 | 26.14 | 26.08 | | 150 day SMA | 23.22 | 23.11 | 23 | | 200 day SMA | 20.59 | 20.52 | 20.45 |
|
|
