PpgIndustries PPG full analysis,charts,indicators,moving averages,SMA,DMA,EMA,ADX,MACD,RSIPpg Industries PPG WideScreen charts, DMA,SMA,EMA technical analysis, forecast prediction, by indicators ADX,MACD,RSI,CCI USA stock exchange
operates under Basic Industries sector & deals in Paints Coatings
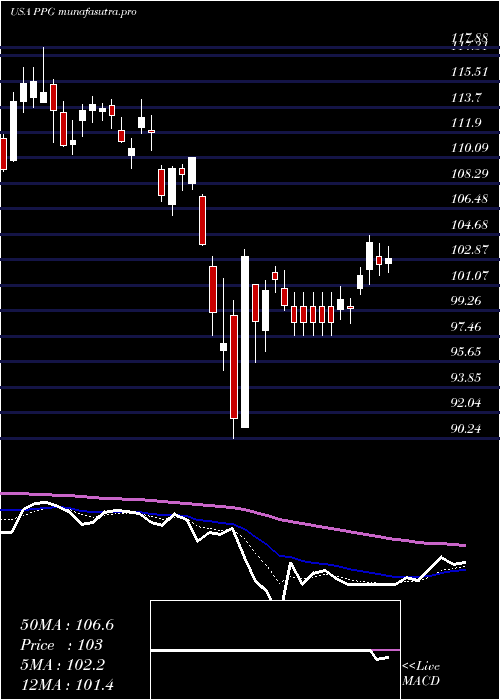
Daily price and charts and targets PpgIndustries Strong Daily Stock price targets for PpgIndustries PPG are 99.67 and 101.34 | Daily Target 1 | 99.33 | | Daily Target 2 | 100 | | Daily Target 3 | 101 | | Daily Target 4 | 101.67 | | Daily Target 5 | 102.67 |
Daily price and volume Ppg Industries
| Date |
Closing |
Open |
Range |
Volume |
Thu 04 December 2025 |
100.67 (-0.66%) |
101.48 |
100.33 - 102.00 |
0.9118 times |
Wed 03 December 2025 |
101.34 (1.09%) |
100.50 |
100.04 - 101.70 |
0.7884 times |
Tue 02 December 2025 |
100.25 (0.39%) |
100.31 |
99.00 - 100.60 |
0.8116 times |
Mon 01 December 2025 |
99.86 (-0.18%) |
99.30 |
98.55 - 101.75 |
1.0409 times |
Fri 28 November 2025 |
100.04 (0.15%) |
100.18 |
99.96 - 100.82 |
0.3161 times |
Wed 26 November 2025 |
99.89 (0.29%) |
99.37 |
99.25 - 100.75 |
0.6417 times |
Tue 25 November 2025 |
99.60 (2.51%) |
98.12 |
97.71 - 100.17 |
1.3103 times |
Mon 24 November 2025 |
97.16 (-1.56%) |
98.41 |
96.83 - 98.71 |
1.381 times |
Fri 21 November 2025 |
98.70 (3.68%) |
96.42 |
95.91 - 100.80 |
1.7452 times |
Thu 20 November 2025 |
95.20 (0.91%) |
95.52 |
94.46 - 96.00 |
1.0531 times |
Wed 19 November 2025 |
94.34 (-0.51%) |
94.94 |
93.39 - 95.56 |
1.077 times |
Weekly price and charts PpgIndustries Strong weekly Stock price targets for PpgIndustries PPG are 99.61 and 103.06 | Weekly Target 1 | 96.96 | | Weekly Target 2 | 98.81 | | Weekly Target 3 | 100.40666666667 | | Weekly Target 4 | 102.26 | | Weekly Target 5 | 103.86 |
Weekly price and volumes for Ppg Industries
| Date |
Closing |
Open |
Range |
Volume |
Thu 04 December 2025 |
100.67 (0.63%) |
99.30 |
98.55 - 102.00 |
0.8908 times |
Fri 28 November 2025 |
100.04 (1.36%) |
98.41 |
96.83 - 100.82 |
0.915 times |
Fri 21 November 2025 |
98.70 (1.72%) |
96.72 |
93.39 - 100.80 |
1.5716 times |
Fri 14 November 2025 |
97.03 (0.81%) |
95.73 |
94.34 - 98.77 |
0.8885 times |
Fri 07 November 2025 |
96.25 (-1.53%) |
94.33 |
93.74 - 97.00 |
1.2355 times |
Fri 31 October 2025 |
97.75 (0%) |
96.94 |
96.50 - 98.17 |
0.36 times |
Fri 31 October 2025 |
97.75 (-5.56%) |
104.00 |
96.50 - 106.71 |
1.6668 times |
Fri 24 October 2025 |
103.50 (1.9%) |
102.00 |
101.53 - 104.84 |
0.777 times |
Fri 17 October 2025 |
101.57 (3.14%) |
99.24 |
97.99 - 101.84 |
0.8453 times |
Fri 10 October 2025 |
98.48 (-5.7%) |
104.91 |
98.44 - 105.13 |
0.8496 times |
Fri 03 October 2025 |
104.43 (0.75%) |
104.44 |
102.90 - 105.51 |
0.8745 times |
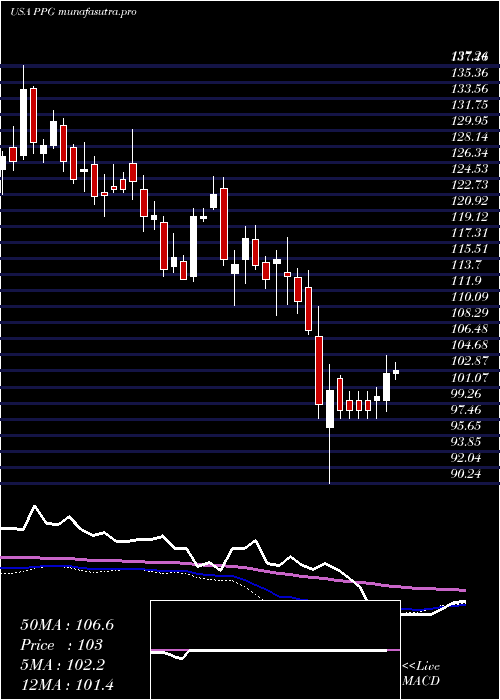
Monthly price and charts PpgIndustries Strong monthly Stock price targets for PpgIndustries PPG are 99.61 and 103.06 | Monthly Target 1 | 96.96 | | Monthly Target 2 | 98.81 | | Monthly Target 3 | 100.40666666667 | | Monthly Target 4 | 102.26 | | Monthly Target 5 | 103.86 |
Monthly price and volumes Ppg Industries
| Date |
Closing |
Open |
Range |
Volume |
Thu 04 December 2025 |
100.67 (0.63%) |
99.30 |
98.55 - 102.00 |
0.2081 times |
Fri 28 November 2025 |
100.04 (2.34%) |
94.33 |
93.39 - 100.82 |
1.077 times |
Fri 31 October 2025 |
97.75 (-7%) |
104.96 |
96.50 - 106.71 |
1.1486 times |
Tue 30 September 2025 |
105.11 (-5.5%) |
109.24 |
102.90 - 112.15 |
1.071 times |
Fri 29 August 2025 |
111.23 (5.43%) |
104.14 |
102.78 - 115.50 |
0.8101 times |
Thu 31 July 2025 |
105.50 (-7.25%) |
113.25 |
105.18 - 120.91 |
1.1621 times |
Mon 30 June 2025 |
113.75 (2.66%) |
110.35 |
106.08 - 115.57 |
0.9332 times |
Fri 30 May 2025 |
110.80 (1.78%) |
109.46 |
105.90 - 117.46 |
1.0117 times |
Wed 30 April 2025 |
108.86 (-0.45%) |
109.35 |
90.24 - 110.11 |
1.3879 times |
Mon 31 March 2025 |
109.35 (-3.42%) |
114.95 |
105.99 - 117.88 |
1.1901 times |
Fri 28 February 2025 |
113.22 (-1.87%) |
113.85 |
110.20 - 119.29 |
1.0142 times |

DMA SMA EMA moving averages of Ppg Industries PPG
DMA (daily moving average) of Ppg Industries PPG
| DMA period | DMA value | | 5 day DMA | 100.43 | | 12 day DMA | 98.49 | | 20 day DMA | 97.66 | | 35 day DMA | 99.01 | | 50 day DMA | 99.98 | | 100 day DMA | 105.3 | | 150 day DMA | 107.73 | | 200 day DMA | 107.63 | EMA (exponential moving average) of Ppg Industries PPG
| EMA period | EMA current | EMA prev | EMA prev2 | | 5 day EMA | 100.34 | 100.17 | 99.58 | | 12 day EMA | 99.25 | 98.99 | 98.56 | | 20 day EMA | 98.93 | 98.75 | 98.48 | | 35 day EMA | 99.57 | 99.51 | 99.4 | | 50 day EMA | 100.68 | 100.68 | 100.65 |
SMA (simple moving average) of Ppg Industries PPG
| SMA period | SMA current | SMA prev | SMA prev2 | | 5 day SMA | 100.43 | 100.28 | 99.93 | | 12 day SMA | 98.49 | 98.05 | 97.69 | | 20 day SMA | 97.66 | 97.44 | 97.11 | | 35 day SMA | 99.01 | 98.98 | 98.96 | | 50 day SMA | 99.98 | 100.08 | 100.17 | | 100 day SMA | 105.3 | 105.43 | 105.58 | | 150 day SMA | 107.73 | 107.78 | 107.8 | | 200 day SMA | 107.63 | 107.71 | 107.8 |
|
|
