PowerIntegrations POWI full analysis,charts,indicators,moving averages,SMA,DMA,EMA,ADX,MACD,RSIPower Integrations POWI WideScreen charts, DMA,SMA,EMA technical analysis, forecast prediction, by indicators ADX,MACD,RSI,CCI USA stock exchange
operates under Technology sector & deals in Semiconductors
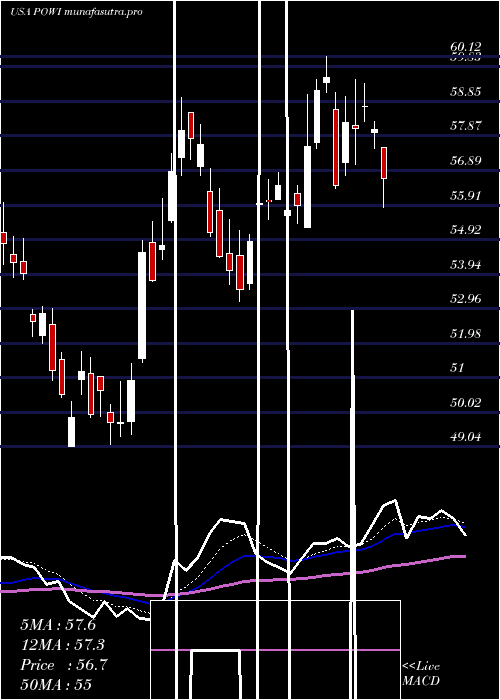
Daily price and charts and targets PowerIntegrations Strong Daily Stock price targets for PowerIntegrations POWI are 36.07 and 37.27 | Daily Target 1 | 35.1 | | Daily Target 2 | 35.84 | | Daily Target 3 | 36.3 | | Daily Target 4 | 37.04 | | Daily Target 5 | 37.5 |
Daily price and volume Power Integrations
| Date |
Closing |
Open |
Range |
Volume |
Thu 04 December 2025 |
36.58 (1.08%) |
36.13 |
35.56 - 36.76 |
0.8189 times |
Wed 03 December 2025 |
36.19 (4.72%) |
34.91 |
34.75 - 36.66 |
1.0071 times |
Tue 02 December 2025 |
34.56 (2.58%) |
34.03 |
33.50 - 34.89 |
0.865 times |
Mon 01 December 2025 |
33.69 (0.27%) |
33.09 |
32.81 - 34.41 |
1.093 times |
Fri 28 November 2025 |
33.60 (-0.39%) |
33.42 |
33.29 - 33.74 |
0.4285 times |
Wed 26 November 2025 |
33.73 (0.66%) |
33.39 |
33.24 - 33.93 |
1.1419 times |
Tue 25 November 2025 |
33.51 (0.87%) |
32.83 |
32.53 - 33.76 |
0.6775 times |
Mon 24 November 2025 |
33.22 (0.48%) |
33.11 |
32.67 - 33.93 |
1.2175 times |
Fri 21 November 2025 |
33.06 (6.92%) |
30.97 |
30.97 - 33.20 |
1.6499 times |
Thu 20 November 2025 |
30.92 (-2.12%) |
32.25 |
30.86 - 32.28 |
1.1007 times |
Wed 19 November 2025 |
31.59 (-0.75%) |
31.83 |
31.40 - 32.42 |
0.9476 times |
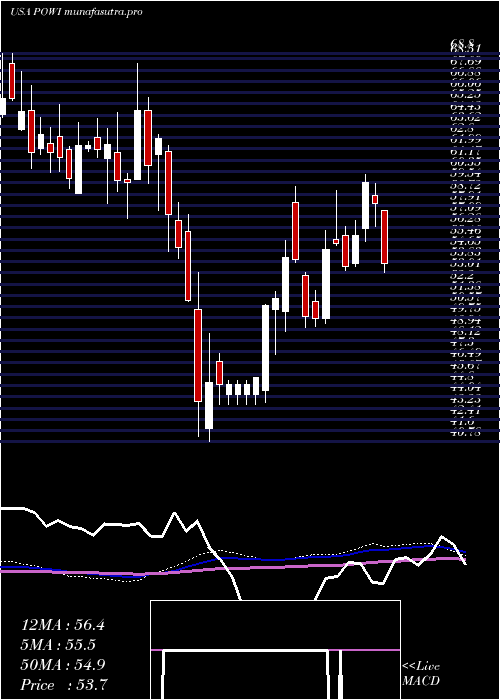
Weekly price and charts PowerIntegrations Strong weekly Stock price targets for PowerIntegrations POWI are 34.7 and 38.65 | Weekly Target 1 | 31.43 | | Weekly Target 2 | 34.01 | | Weekly Target 3 | 35.383333333333 | | Weekly Target 4 | 37.96 | | Weekly Target 5 | 39.33 |
Weekly price and volumes for Power Integrations
| Date |
Closing |
Open |
Range |
Volume |
Thu 04 December 2025 |
36.58 (8.87%) |
33.09 |
32.81 - 36.76 |
0.5396 times |
Fri 28 November 2025 |
33.60 (1.63%) |
33.11 |
32.53 - 33.93 |
0.4942 times |
Fri 21 November 2025 |
33.06 (-4.45%) |
34.21 |
30.86 - 34.35 |
0.9479 times |
Fri 14 November 2025 |
34.60 (-1.96%) |
36.41 |
33.52 - 36.73 |
0.7137 times |
Fri 07 November 2025 |
35.29 (-15.76%) |
40.20 |
34.30 - 40.70 |
0.8112 times |
Fri 31 October 2025 |
41.89 (0%) |
40.69 |
40.32 - 42.55 |
0.2481 times |
Fri 31 October 2025 |
41.89 (-2.6%) |
43.44 |
40.32 - 44.45 |
0.9183 times |
Fri 24 October 2025 |
43.01 (-5.2%) |
46.97 |
41.63 - 46.97 |
0.8359 times |
Fri 17 October 2025 |
45.37 (30.98%) |
35.70 |
35.65 - 50.41 |
3.7704 times |
Fri 10 October 2025 |
34.64 (-10.28%) |
38.99 |
34.55 - 39.56 |
0.7207 times |
Fri 03 October 2025 |
38.61 (-3.52%) |
40.49 |
38.57 - 40.49 |
0.5729 times |
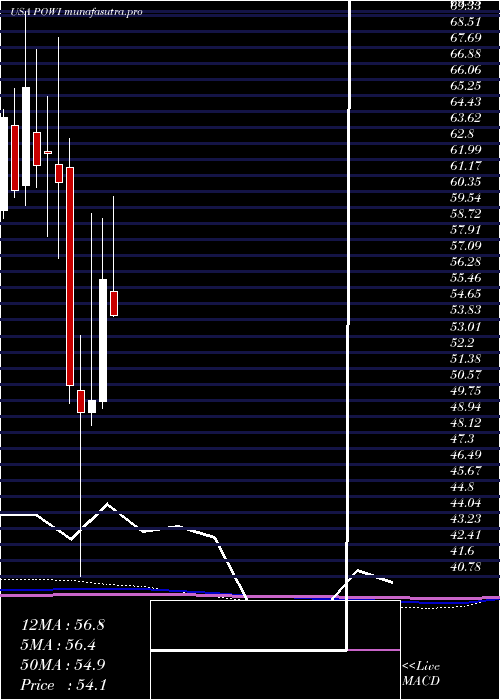
Monthly price and charts PowerIntegrations Strong monthly Stock price targets for PowerIntegrations POWI are 34.7 and 38.65 | Monthly Target 1 | 31.43 | | Monthly Target 2 | 34.01 | | Monthly Target 3 | 35.383333333333 | | Monthly Target 4 | 37.96 | | Monthly Target 5 | 39.33 |
Monthly price and volumes Power Integrations
| Date |
Closing |
Open |
Range |
Volume |
Thu 04 December 2025 |
36.58 (8.87%) |
33.09 |
32.81 - 36.76 |
0.2117 times |
Fri 28 November 2025 |
33.60 (-19.79%) |
40.20 |
30.86 - 40.70 |
1.1638 times |
Fri 31 October 2025 |
41.89 (4.18%) |
39.81 |
34.55 - 50.41 |
2.6828 times |
Tue 30 September 2025 |
40.21 (-10.84%) |
44.07 |
39.15 - 46.24 |
0.9856 times |
Fri 29 August 2025 |
45.10 (-7.05%) |
47.66 |
39.53 - 50.30 |
0.9883 times |
Thu 31 July 2025 |
48.52 (-13.2%) |
55.26 |
47.74 - 60.12 |
0.6978 times |
Mon 30 June 2025 |
55.90 (12.41%) |
49.70 |
49.34 - 58.97 |
0.7093 times |
Fri 30 May 2025 |
49.73 (1.24%) |
49.12 |
48.48 - 59.24 |
0.8623 times |
Wed 30 April 2025 |
49.12 (-2.73%) |
50.22 |
40.78 - 53.02 |
0.9751 times |
Mon 31 March 2025 |
50.50 (-16.94%) |
61.59 |
49.57 - 63.04 |
0.7234 times |
Fri 28 February 2025 |
60.80 (-2.44%) |
61.74 |
56.97 - 68.20 |
0.8059 times |
DMA SMA EMA moving averages of Power Integrations POWI
DMA (daily moving average) of Power Integrations POWI
| DMA period | DMA value | | 5 day DMA | 34.92 | | 12 day DMA | 33.54 | | 20 day DMA | 34.13 | | 35 day DMA | 37.84 | | 50 day DMA | 38.55 | | 100 day DMA | 42.77 | | 150 day DMA | 46.62 | | 200 day DMA | 48.23 | EMA (exponential moving average) of Power Integrations POWI
| EMA period | EMA current | EMA prev | EMA prev2 | | 5 day EMA | 35.27 | 34.62 | 33.83 | | 12 day EMA | 34.67 | 34.32 | 33.98 | | 20 day EMA | 35.21 | 35.07 | 34.95 | | 35 day EMA | 36.52 | 36.52 | 36.54 | | 50 day EMA | 38.55 | 38.63 | 38.73 |
SMA (simple moving average) of Power Integrations POWI
| SMA period | SMA current | SMA prev | SMA prev2 | | 5 day SMA | 34.92 | 34.35 | 33.82 | | 12 day SMA | 33.54 | 33.18 | 33.05 | | 20 day SMA | 34.13 | 34.28 | 34.42 | | 35 day SMA | 37.84 | 38.19 | 38.5 | | 50 day SMA | 38.55 | 38.63 | 38.74 | | 100 day SMA | 42.77 | 42.94 | 43.15 | | 150 day SMA | 46.62 | 46.7 | 46.79 | | 200 day SMA | 48.23 | 48.35 | 48.47 |
|
|
