PortlandGeneral POR full analysis,charts,indicators,moving averages,SMA,DMA,EMA,ADX,MACD,RSIPortland General POR WideScreen charts, DMA,SMA,EMA technical analysis, forecast prediction, by indicators ADX,MACD,RSI,CCI USA stock exchange
operates under Public Utilities sector & deals in Electric Utilities Central
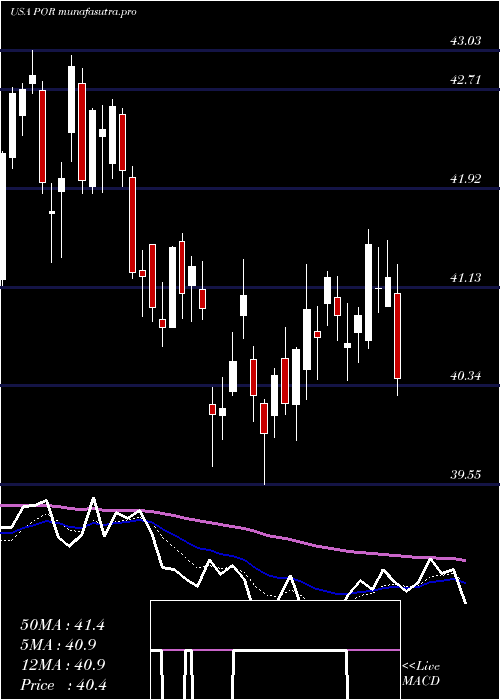
Daily price and charts and targets PortlandGeneral Strong Daily Stock price targets for PortlandGeneral POR are 48.62 and 49.5 | Daily Target 1 | 48 | | Daily Target 2 | 48.36 | | Daily Target 3 | 48.876666666667 | | Daily Target 4 | 49.24 | | Daily Target 5 | 49.76 |
Daily price and volume Portland General
| Date |
Closing |
Open |
Range |
Volume |
Thu 04 December 2025 |
48.73 (-1.22%) |
48.65 |
48.51 - 49.39 |
0.9915 times |
Wed 03 December 2025 |
49.33 (-0.34%) |
49.50 |
49.03 - 49.92 |
1.1244 times |
Tue 02 December 2025 |
49.50 (-1.84%) |
50.56 |
49.41 - 50.56 |
1.2438 times |
Mon 01 December 2025 |
50.43 (-0.77%) |
50.57 |
50.19 - 50.80 |
0.8662 times |
Fri 28 November 2025 |
50.82 (0.16%) |
50.96 |
50.51 - 51.14 |
0.4814 times |
Wed 26 November 2025 |
50.74 (0.83%) |
50.27 |
50.21 - 50.87 |
1.0729 times |
Tue 25 November 2025 |
50.32 (1.04%) |
50.00 |
50.00 - 50.58 |
1.285 times |
Mon 24 November 2025 |
49.80 (0.46%) |
49.68 |
49.06 - 49.98 |
0.943 times |
Fri 21 November 2025 |
49.57 (0.75%) |
49.36 |
49.34 - 50.01 |
0.9597 times |
Thu 20 November 2025 |
49.20 (1.07%) |
48.88 |
48.88 - 49.62 |
1.0321 times |
Wed 19 November 2025 |
48.68 (-0.27%) |
48.71 |
48.44 - 48.99 |
1.1669 times |
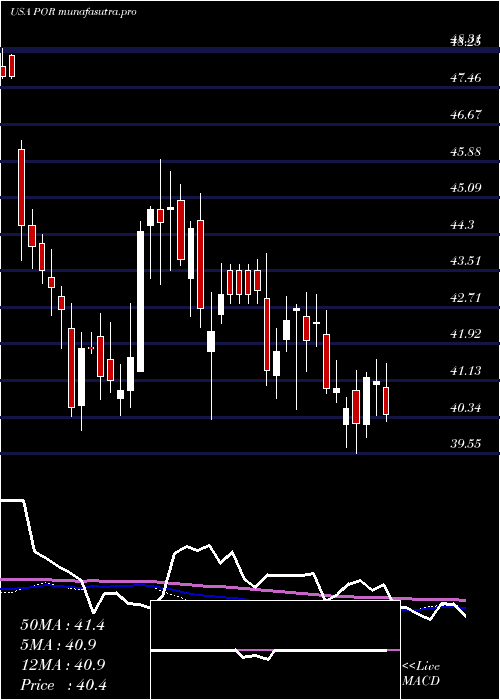
Weekly price and charts PortlandGeneral Strong weekly Stock price targets for PortlandGeneral POR are 47.48 and 49.77 | Weekly Target 1 | 47.06 | | Weekly Target 2 | 47.89 | | Weekly Target 3 | 49.346666666667 | | Weekly Target 4 | 50.18 | | Weekly Target 5 | 51.64 |
Weekly price and volumes for Portland General
| Date |
Closing |
Open |
Range |
Volume |
Thu 04 December 2025 |
48.73 (-4.11%) |
50.57 |
48.51 - 50.80 |
0.8859 times |
Fri 28 November 2025 |
50.82 (2.52%) |
49.68 |
49.06 - 51.14 |
0.7929 times |
Fri 21 November 2025 |
49.57 (0.28%) |
49.43 |
48.44 - 50.01 |
1.1163 times |
Fri 14 November 2025 |
49.43 (3.3%) |
47.76 |
47.52 - 50.95 |
1.6833 times |
Fri 07 November 2025 |
47.85 (4.75%) |
47.18 |
47.01 - 48.19 |
1.0905 times |
Fri 31 October 2025 |
45.68 (0%) |
45.15 |
44.55 - 46.38 |
0.3886 times |
Fri 31 October 2025 |
45.68 (-1.04%) |
46.20 |
44.55 - 46.62 |
1.5582 times |
Fri 24 October 2025 |
46.16 (3.5%) |
44.90 |
44.56 - 46.19 |
1.0634 times |
Fri 17 October 2025 |
44.60 (1.78%) |
43.52 |
43.15 - 44.73 |
0.9877 times |
Tue 07 October 2025 |
43.82 (1.51%) |
43.16 |
43.16 - 44.20 |
0.4333 times |
Fri 03 October 2025 |
43.17 (-0.62%) |
43.50 |
42.58 - 44.22 |
1.2306 times |
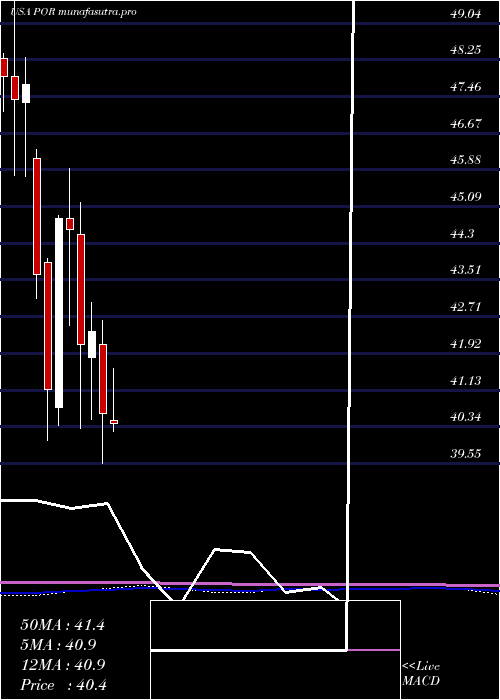
Monthly price and charts PortlandGeneral Strong monthly Stock price targets for PortlandGeneral POR are 47.48 and 49.77 | Monthly Target 1 | 47.06 | | Monthly Target 2 | 47.89 | | Monthly Target 3 | 49.346666666667 | | Monthly Target 4 | 50.18 | | Monthly Target 5 | 51.64 |
Monthly price and volumes Portland General
| Date |
Closing |
Open |
Range |
Volume |
Thu 04 December 2025 |
48.73 (-4.11%) |
50.57 |
48.51 - 50.80 |
0.2042 times |
Fri 28 November 2025 |
50.82 (11.25%) |
47.18 |
47.01 - 51.14 |
1.0794 times |
Fri 31 October 2025 |
45.68 (3.82%) |
44.10 |
42.58 - 46.62 |
1.2085 times |
Tue 30 September 2025 |
44.00 (2.85%) |
42.52 |
41.80 - 44.10 |
1.0266 times |
Fri 29 August 2025 |
42.78 (4.04%) |
41.35 |
41.00 - 43.26 |
1.0115 times |
Thu 31 July 2025 |
41.12 (1.21%) |
40.47 |
39.73 - 42.22 |
1.3969 times |
Mon 30 June 2025 |
40.63 (-4.17%) |
42.12 |
39.55 - 42.64 |
1.0722 times |
Fri 30 May 2025 |
42.40 (0.66%) |
41.84 |
40.50 - 43.03 |
0.8439 times |
Wed 30 April 2025 |
42.12 (-5.56%) |
44.49 |
40.29 - 45.17 |
1.1384 times |
Mon 31 March 2025 |
44.60 (-0.51%) |
44.82 |
42.52 - 45.91 |
1.0185 times |
Fri 28 February 2025 |
44.83 (8.97%) |
40.75 |
40.37 - 44.89 |
0.9902 times |
DMA SMA EMA moving averages of Portland General POR
DMA (daily moving average) of Portland General POR
| DMA period | DMA value | | 5 day DMA | 49.76 | | 12 day DMA | 49.66 | | 20 day DMA | 49.51 | | 35 day DMA | 47.89 | | 50 day DMA | 46.53 | | 100 day DMA | 44.24 | | 150 day DMA | 43.33 | | 200 day DMA | 43.4 | EMA (exponential moving average) of Portland General POR
| EMA period | EMA current | EMA prev | EMA prev2 | | 5 day EMA | 49.46 | 49.82 | 50.07 | | 12 day EMA | 49.52 | 49.66 | 49.72 | | 20 day EMA | 49.06 | 49.09 | 49.07 | | 35 day EMA | 47.9 | 47.85 | 47.76 | | 50 day EMA | 46.51 | 46.42 | 46.3 |
SMA (simple moving average) of Portland General POR
| SMA period | SMA current | SMA prev | SMA prev2 | | 5 day SMA | 49.76 | 50.16 | 50.36 | | 12 day SMA | 49.66 | 49.7 | 49.7 | | 20 day SMA | 49.51 | 49.46 | 49.36 | | 35 day SMA | 47.89 | 47.75 | 47.58 | | 50 day SMA | 46.53 | 46.42 | 46.28 | | 100 day SMA | 44.24 | 44.17 | 44.08 | | 150 day SMA | 43.33 | 43.28 | 43.24 | | 200 day SMA | 43.4 | 43.36 | 43.33 |
|
|
