PoolCorporation POOL full analysis,charts,indicators,moving averages,SMA,DMA,EMA,ADX,MACD,RSIPool Corporation POOL WideScreen charts, DMA,SMA,EMA technical analysis, forecast prediction, by indicators ADX,MACD,RSI,CCI USA stock exchange
operates under Consumer Durables sector & deals in Industrial Specialties
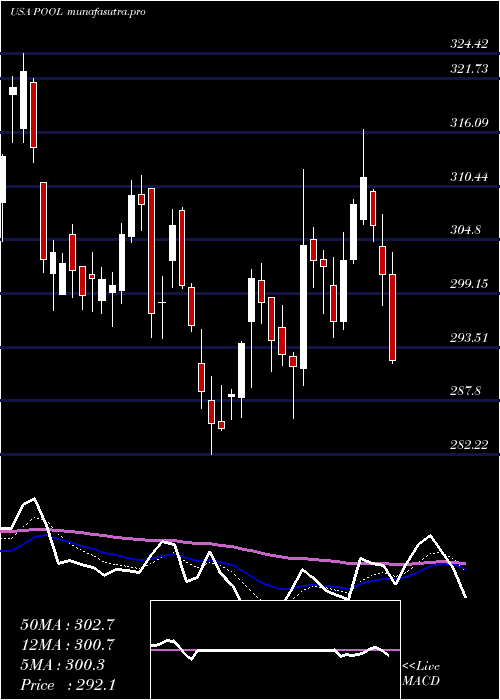
Daily price and charts and targets PoolCorporation Strong Daily Stock price targets for PoolCorporation POOL are 237.77 and 244.98 | Daily Target 1 | 236.39 | | Daily Target 2 | 239.15 | | Daily Target 3 | 243.59666666667 | | Daily Target 4 | 246.36 | | Daily Target 5 | 250.81 |
Daily price and volume Pool Corporation
| Date |
Closing |
Open |
Range |
Volume |
Thu 04 December 2025 |
241.92 (-1.65%) |
246.37 |
240.83 - 248.04 |
0.8868 times |
Wed 03 December 2025 |
245.98 (0.51%) |
246.13 |
245.48 - 251.73 |
0.8958 times |
Tue 02 December 2025 |
244.74 (0.56%) |
245.00 |
241.26 - 247.34 |
0.6945 times |
Mon 01 December 2025 |
243.37 (-0.09%) |
240.51 |
240.31 - 248.39 |
1.0155 times |
Fri 28 November 2025 |
243.60 (-0.27%) |
246.31 |
243.34 - 246.40 |
0.3462 times |
Wed 26 November 2025 |
244.27 (0.16%) |
242.99 |
241.71 - 246.39 |
0.8156 times |
Tue 25 November 2025 |
243.89 (3.05%) |
238.82 |
238.51 - 246.12 |
1.3894 times |
Mon 24 November 2025 |
236.67 (-1.38%) |
240.03 |
235.17 - 240.31 |
1.008 times |
Fri 21 November 2025 |
239.98 (4.24%) |
232.34 |
229.81 - 243.42 |
1.561 times |
Thu 20 November 2025 |
230.21 (-1.57%) |
235.05 |
229.63 - 237.17 |
1.387 times |
Wed 19 November 2025 |
233.88 (-2.65%) |
240.24 |
231.53 - 241.83 |
1.6047 times |
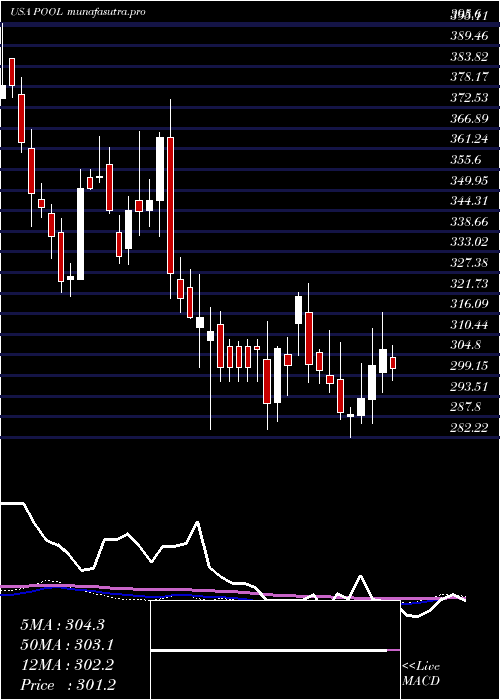
Weekly price and charts PoolCorporation Strong weekly Stock price targets for PoolCorporation POOL are 241.12 and 252.54 | Weekly Target 1 | 233.23 | | Weekly Target 2 | 237.58 | | Weekly Target 3 | 244.65333333333 | | Weekly Target 4 | 249 | | Weekly Target 5 | 256.07 |
Weekly price and volumes for Pool Corporation
| Date |
Closing |
Open |
Range |
Volume |
Thu 04 December 2025 |
241.92 (-0.69%) |
240.51 |
240.31 - 251.73 |
0.639 times |
Fri 28 November 2025 |
243.60 (1.51%) |
240.03 |
235.17 - 246.40 |
0.6512 times |
Fri 21 November 2025 |
239.98 (-0.97%) |
242.83 |
229.63 - 244.99 |
1.3911 times |
Fri 14 November 2025 |
242.32 (-3.85%) |
251.85 |
241.90 - 255.66 |
1.1296 times |
Fri 07 November 2025 |
252.01 (-5.64%) |
259.37 |
242.10 - 259.48 |
1.5706 times |
Fri 31 October 2025 |
267.06 (0%) |
277.05 |
266.00 - 277.05 |
0.4194 times |
Fri 31 October 2025 |
267.06 (-9.09%) |
295.85 |
266.00 - 297.50 |
1.2143 times |
Fri 24 October 2025 |
293.75 (1.22%) |
290.73 |
290.23 - 305.63 |
1.3301 times |
Fri 17 October 2025 |
290.21 (0.1%) |
291.55 |
287.19 - 299.51 |
0.9076 times |
Fri 10 October 2025 |
289.91 (-6.36%) |
310.42 |
289.11 - 310.99 |
0.7471 times |
Fri 03 October 2025 |
309.61 (1.23%) |
308.28 |
304.43 - 313.75 |
0.5811 times |
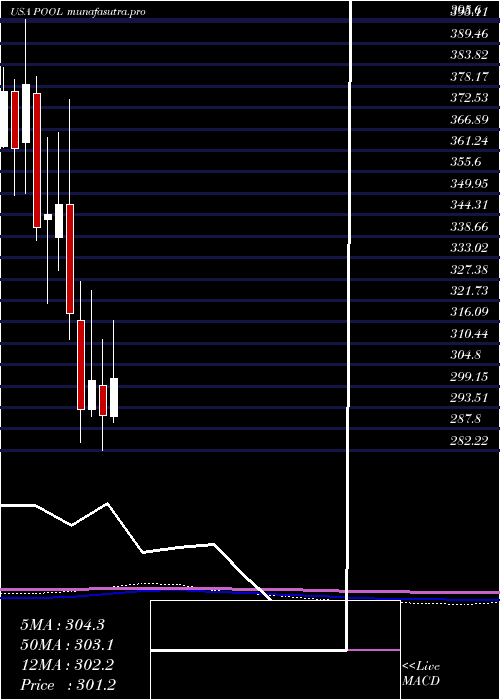
Monthly price and charts PoolCorporation Strong monthly Stock price targets for PoolCorporation POOL are 241.12 and 252.54 | Monthly Target 1 | 233.23 | | Monthly Target 2 | 237.58 | | Monthly Target 3 | 244.65333333333 | | Monthly Target 4 | 249 | | Monthly Target 5 | 256.07 |
Monthly price and volumes Pool Corporation
| Date |
Closing |
Open |
Range |
Volume |
Thu 04 December 2025 |
241.92 (-0.69%) |
240.51 |
240.31 - 251.73 |
0.1827 times |
Fri 28 November 2025 |
243.60 (-8.78%) |
259.37 |
229.63 - 259.48 |
1.3562 times |
Fri 31 October 2025 |
267.06 (-13.87%) |
309.47 |
266.00 - 313.75 |
1.395 times |
Tue 30 September 2025 |
310.07 (-0.21%) |
306.45 |
299.99 - 336.15 |
1.0396 times |
Fri 29 August 2025 |
310.71 (0.83%) |
307.36 |
301.24 - 333.95 |
0.8369 times |
Thu 31 July 2025 |
308.14 (5.72%) |
291.29 |
286.24 - 345.00 |
1.2196 times |
Mon 30 June 2025 |
291.48 (-3.03%) |
299.28 |
282.22 - 311.51 |
1.249 times |
Fri 30 May 2025 |
300.59 (2.54%) |
292.98 |
291.19 - 324.42 |
1.0026 times |
Wed 30 April 2025 |
293.14 (-7.92%) |
316.54 |
284.28 - 326.70 |
1.0528 times |
Mon 31 March 2025 |
318.35 (-8.26%) |
347.00 |
311.45 - 374.74 |
0.6657 times |
Fri 28 February 2025 |
347.00 (0.8%) |
338.26 |
329.61 - 366.00 |
0.7511 times |
DMA SMA EMA moving averages of Pool Corporation POOL
DMA (daily moving average) of Pool Corporation POOL
| DMA period | DMA value | | 5 day DMA | 243.92 | | 12 day DMA | 240.73 | | 20 day DMA | 243.45 | | 35 day DMA | 260.69 | | 50 day DMA | 273.21 | | 100 day DMA | 294.61 | | 150 day DMA | 297.03 | | 200 day DMA | 303.1 | EMA (exponential moving average) of Pool Corporation POOL
| EMA period | EMA current | EMA prev | EMA prev2 | | 5 day EMA | 243.39 | 244.13 | 243.21 | | 12 day EMA | 243.89 | 244.25 | 243.94 | | 20 day EMA | 248.29 | 248.96 | 249.27 | | 35 day EMA | 259.9 | 260.96 | 261.84 | | 50 day EMA | 273.79 | 275.09 | 276.28 |
SMA (simple moving average) of Pool Corporation POOL
| SMA period | SMA current | SMA prev | SMA prev2 | | 5 day SMA | 243.92 | 244.39 | 243.97 | | 12 day SMA | 240.73 | 240.39 | 240.08 | | 20 day SMA | 243.45 | 244 | 244.6 | | 35 day SMA | 260.69 | 262.07 | 263.49 | | 50 day SMA | 273.21 | 274.59 | 275.93 | | 100 day SMA | 294.61 | 295.11 | 295.66 | | 150 day SMA | 297.03 | 297.38 | 297.7 | | 200 day SMA | 303.1 | 303.6 | 304.09 |
|
|
