InsuletCorporation PODD full analysis,charts,indicators,moving averages,SMA,DMA,EMA,ADX,MACD,RSIInsulet Corporation PODD WideScreen charts, DMA,SMA,EMA technical analysis, forecast prediction, by indicators ADX,MACD,RSI,CCI USA stock exchange
operates under Health Care sector & deals in Medical Dental Instruments
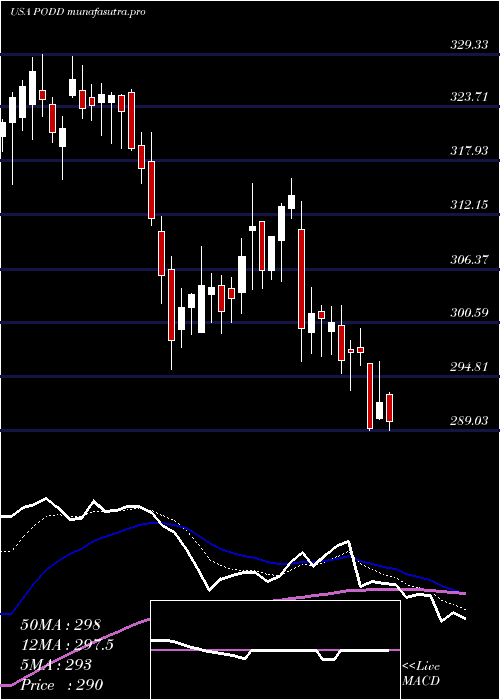
Daily price and charts and targets InsuletCorporation Strong Daily Stock price targets for InsuletCorporation PODD are 322.49 and 331.25 | Daily Target 1 | 315.19 | | Daily Target 2 | 321.02 | | Daily Target 3 | 323.95 | | Daily Target 4 | 329.78 | | Daily Target 5 | 332.71 |
Daily price and volume Insulet Corporation
| Date |
Closing |
Open |
Range |
Volume |
Mon 20 October 2025 |
326.85 (2.59%) |
318.12 |
318.12 - 326.88 |
0.8359 times |
Fri 17 October 2025 |
318.59 (0.73%) |
315.40 |
315.17 - 321.63 |
0.8379 times |
Thu 16 October 2025 |
316.29 (1.23%) |
314.65 |
312.74 - 322.58 |
1.0361 times |
Wed 15 October 2025 |
312.45 (-1.84%) |
317.97 |
312.05 - 319.82 |
0.8889 times |
Tue 14 October 2025 |
318.30 (1.19%) |
314.16 |
312.69 - 323.69 |
0.8023 times |
Mon 13 October 2025 |
314.56 (0.01%) |
314.43 |
312.10 - 317.53 |
1.0287 times |
Fri 10 October 2025 |
314.52 (-1.83%) |
320.69 |
313.53 - 322.54 |
1.2073 times |
Thu 09 October 2025 |
320.38 (1.55%) |
318.24 |
315.84 - 324.69 |
1.2616 times |
Wed 08 October 2025 |
315.49 (0.65%) |
311.32 |
310.07 - 318.14 |
1.0341 times |
Tue 07 October 2025 |
313.45 (0.56%) |
311.98 |
310.02 - 315.44 |
1.0672 times |
Mon 06 October 2025 |
311.69 (0.83%) |
310.90 |
306.03 - 312.08 |
1.1975 times |
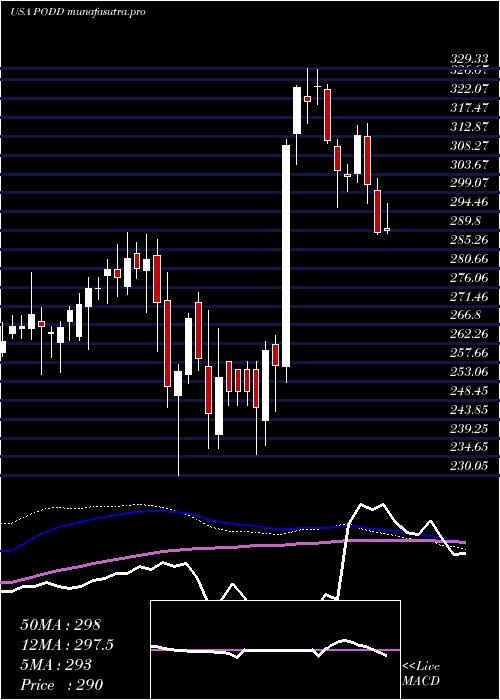
Weekly price and charts InsuletCorporation Strong weekly Stock price targets for InsuletCorporation PODD are 322.49 and 331.25 | Weekly Target 1 | 315.19 | | Weekly Target 2 | 321.02 | | Weekly Target 3 | 323.95 | | Weekly Target 4 | 329.78 | | Weekly Target 5 | 332.71 |
Weekly price and volumes for Insulet Corporation
| Date |
Closing |
Open |
Range |
Volume |
Mon 20 October 2025 |
326.85 (2.59%) |
318.12 |
318.12 - 326.88 |
0.1573 times |
Fri 17 October 2025 |
318.59 (1.29%) |
314.43 |
312.05 - 323.69 |
0.8642 times |
Fri 10 October 2025 |
314.52 (1.75%) |
310.90 |
306.03 - 324.69 |
1.085 times |
Fri 03 October 2025 |
309.12 (-2.79%) |
319.60 |
288.02 - 319.60 |
1.5539 times |
Fri 26 September 2025 |
318.00 (-3.88%) |
330.31 |
312.59 - 336.02 |
1.1572 times |
Fri 19 September 2025 |
330.84 (-3.2%) |
342.00 |
313.24 - 345.74 |
1.6607 times |
Fri 12 September 2025 |
341.78 (-1.91%) |
349.56 |
330.00 - 353.50 |
1.2636 times |
Fri 05 September 2025 |
348.43 (2.52%) |
338.13 |
334.91 - 350.00 |
0.9965 times |
Fri 29 August 2025 |
339.88 (0%) |
337.31 |
335.80 - 341.14 |
0.2155 times |
Fri 29 August 2025 |
339.88 (2.75%) |
329.88 |
327.17 - 341.14 |
1.046 times |
Fri 22 August 2025 |
330.77 (2.96%) |
321.32 |
320.75 - 334.18 |
1.0745 times |
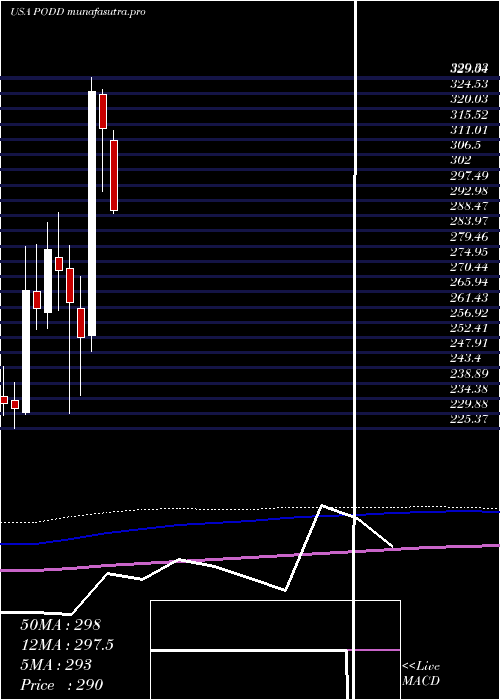
Monthly price and charts InsuletCorporation Strong monthly Stock price targets for InsuletCorporation PODD are 307.44 and 346.3 | Monthly Target 1 | 275.06 | | Monthly Target 2 | 300.95 | | Monthly Target 3 | 313.91666666667 | | Monthly Target 4 | 339.81 | | Monthly Target 5 | 352.78 |
Monthly price and volumes Insulet Corporation
| Date |
Closing |
Open |
Range |
Volume |
Mon 20 October 2025 |
326.85 (5.87%) |
308.75 |
288.02 - 326.88 |
0.4968 times |
Tue 30 September 2025 |
308.73 (-9.16%) |
338.13 |
304.64 - 353.50 |
0.9673 times |
Fri 29 August 2025 |
339.88 (17.85%) |
286.25 |
276.46 - 341.14 |
1.0179 times |
Thu 31 July 2025 |
288.40 (-8.21%) |
310.54 |
280.43 - 313.54 |
0.8769 times |
Mon 30 June 2025 |
314.18 (-3.34%) |
324.23 |
295.56 - 325.61 |
1.1246 times |
Fri 30 May 2025 |
325.03 (28.83%) |
252.94 |
248.40 - 329.33 |
1.4241 times |
Wed 30 April 2025 |
252.29 (-3.93%) |
260.92 |
235.34 - 270.33 |
1.1517 times |
Mon 31 March 2025 |
262.61 (-3.55%) |
272.87 |
230.05 - 279.64 |
1.1334 times |
Fri 28 February 2025 |
272.27 (-2.19%) |
276.17 |
260.42 - 289.46 |
0.9655 times |
Fri 31 January 2025 |
278.38 (6.63%) |
259.84 |
255.20 - 286.39 |
0.8417 times |
Tue 31 December 2024 |
261.07 (-2.01%) |
266.09 |
254.79 - 279.77 |
0.6071 times |
DMA SMA EMA moving averages of Insulet Corporation PODD
DMA (daily moving average) of Insulet Corporation PODD
| DMA period | DMA value | | 5 day DMA | 318.5 | | 12 day DMA | 315.97 | | 20 day DMA | 316.28 | | 35 day DMA | 326.36 | | 50 day DMA | 326.66 | | 100 day DMA | 313.69 | | 150 day DMA | 299.86 | | 200 day DMA | 292.97 | EMA (exponential moving average) of Insulet Corporation PODD
| EMA period | EMA current | EMA prev | EMA prev2 | | 5 day EMA | 319.91 | 316.44 | 315.36 | | 12 day EMA | 318.02 | 316.42 | 316.02 | | 20 day EMA | 318.91 | 318.08 | 318.03 | | 35 day EMA | 320.1 | 319.7 | 319.77 | | 50 day EMA | 323.27 | 323.12 | 323.31 |
SMA (simple moving average) of Insulet Corporation PODD
| SMA period | SMA current | SMA prev | SMA prev2 | | 5 day SMA | 318.5 | 316.04 | 315.22 | | 12 day SMA | 315.97 | 314.75 | 313.7 | | 20 day SMA | 316.28 | 316.69 | 317.31 | | 35 day SMA | 326.36 | 326.74 | 327.34 | | 50 day SMA | 326.66 | 326.22 | 325.99 | | 100 day SMA | 313.69 | 313.68 | 313.71 | | 150 day SMA | 299.86 | 299.31 | 298.85 | | 200 day SMA | 292.97 | 292.64 | 292.36 |
|
|
