InvescoNasdaq PNQI full analysis,charts,indicators,moving averages,SMA,DMA,EMA,ADX,MACD,RSIInvesco Nasdaq PNQI WideScreen charts, DMA,SMA,EMA technical analysis, forecast prediction, by indicators ADX,MACD,RSI,CCI USA stock exchange
operates under N A sector & deals in N A
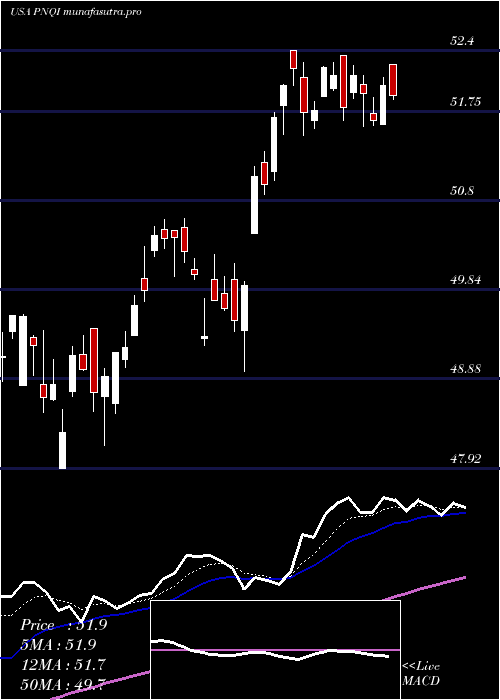
Daily price and charts and targets InvescoNasdaq Strong Daily Stock price targets for InvescoNasdaq PNQI are 53.93 and 54.47 | Daily Target 1 | 53.77 | | Daily Target 2 | 54.08 | | Daily Target 3 | 54.313333333333 | | Daily Target 4 | 54.62 | | Daily Target 5 | 54.85 |
Daily price and volume Invesco Nasdaq
| Date |
Closing |
Open |
Range |
Volume |
Thu 04 December 2025 |
54.38 (0.2%) |
54.55 |
54.01 - 54.55 |
0.6126 times |
Wed 03 December 2025 |
54.27 (-0.2%) |
54.12 |
54.12 - 54.41 |
0.3755 times |
Tue 02 December 2025 |
54.38 (0.87%) |
54.08 |
53.96 - 54.53 |
0.8385 times |
Mon 01 December 2025 |
53.91 (-0.37%) |
53.73 |
53.68 - 54.14 |
0.559 times |
Fri 28 November 2025 |
54.11 (0.93%) |
53.80 |
53.80 - 54.11 |
0.2569 times |
Wed 26 November 2025 |
53.61 (0.17%) |
53.67 |
53.59 - 53.84 |
0.7256 times |
Tue 25 November 2025 |
53.52 (1.29%) |
53.05 |
53.00 - 53.58 |
1.3043 times |
Mon 24 November 2025 |
52.84 (2.19%) |
52.21 |
52.21 - 52.89 |
1.1773 times |
Fri 21 November 2025 |
51.71 (1.35%) |
51.18 |
51.08 - 52.12 |
0.8554 times |
Thu 20 November 2025 |
51.02 (-2.5%) |
53.16 |
51.00 - 53.16 |
3.2947 times |
Wed 19 November 2025 |
52.33 (-0.65%) |
52.70 |
52.14 - 53.00 |
0.7425 times |
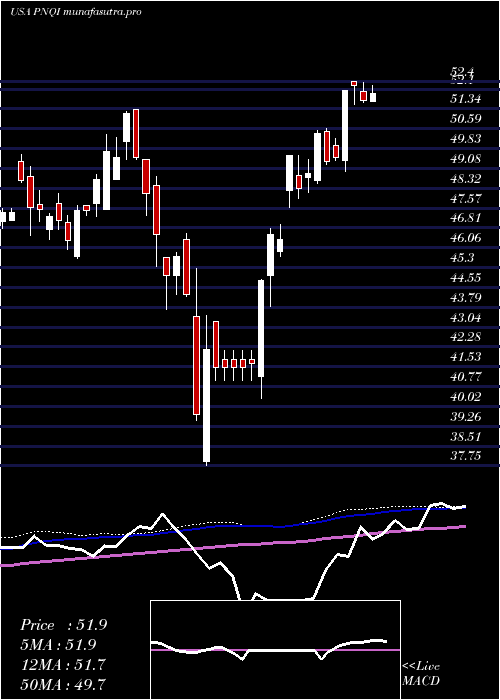
Weekly price and charts InvescoNasdaq Strong weekly Stock price targets for InvescoNasdaq PNQI are 54.03 and 54.9 | Weekly Target 1 | 53.33 | | Weekly Target 2 | 53.86 | | Weekly Target 3 | 54.203333333333 | | Weekly Target 4 | 54.73 | | Weekly Target 5 | 55.07 |
Weekly price and volumes for Invesco Nasdaq
| Date |
Closing |
Open |
Range |
Volume |
Thu 04 December 2025 |
54.38 (0.5%) |
53.73 |
53.68 - 54.55 |
0.4907 times |
Fri 28 November 2025 |
54.11 (4.64%) |
52.21 |
52.21 - 54.11 |
0.7125 times |
Fri 21 November 2025 |
51.71 (-3.26%) |
53.45 |
51.00 - 53.75 |
1.627 times |
Fri 14 November 2025 |
53.45 (-1.02%) |
54.72 |
52.98 - 55.29 |
1.0016 times |
Fri 07 November 2025 |
54.00 (-3.78%) |
54.93 |
53.17 - 55.57 |
1.2502 times |
Fri 31 October 2025 |
56.12 (0%) |
56.21 |
56.03 - 56.37 |
0.0656 times |
Fri 31 October 2025 |
56.12 (0.43%) |
56.68 |
55.68 - 57.22 |
1.3448 times |
Fri 24 October 2025 |
55.88 (2.53%) |
54.83 |
54.75 - 56.11 |
0.7874 times |
Fri 17 October 2025 |
54.50 (0.66%) |
54.76 |
53.87 - 55.41 |
1.4888 times |
Fri 10 October 2025 |
54.14 (-2.87%) |
55.94 |
54.09 - 56.45 |
1.2314 times |
Fri 03 October 2025 |
55.74 (-0.54%) |
56.41 |
55.30 - 56.58 |
0.8376 times |
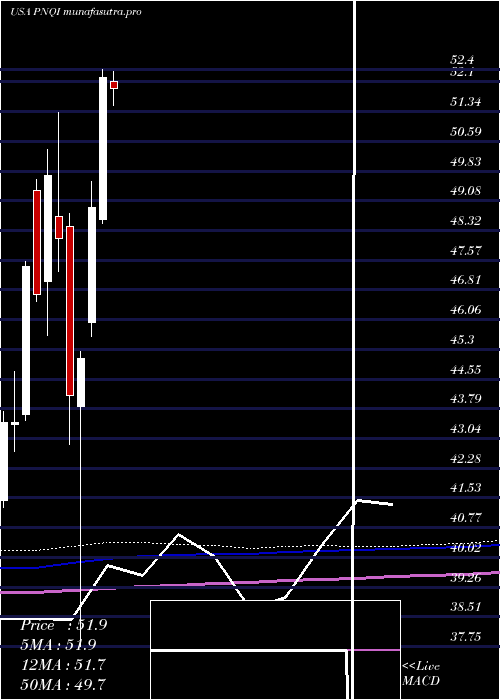
Monthly price and charts InvescoNasdaq Strong monthly Stock price targets for InvescoNasdaq PNQI are 54.03 and 54.9 | Monthly Target 1 | 53.33 | | Monthly Target 2 | 53.86 | | Monthly Target 3 | 54.203333333333 | | Monthly Target 4 | 54.73 | | Monthly Target 5 | 55.07 |
Monthly price and volumes Invesco Nasdaq
| Date |
Closing |
Open |
Range |
Volume |
Thu 04 December 2025 |
54.38 (0.5%) |
53.73 |
53.68 - 54.55 |
0.0862 times |
Fri 28 November 2025 |
54.11 (-3.58%) |
54.93 |
51.00 - 55.57 |
0.8068 times |
Fri 31 October 2025 |
56.12 (0.52%) |
55.39 |
53.87 - 57.22 |
0.9519 times |
Tue 30 September 2025 |
55.83 (3.26%) |
53.31 |
52.94 - 57.16 |
0.9081 times |
Fri 29 August 2025 |
54.07 (2.6%) |
51.78 |
51.08 - 54.35 |
0.8382 times |
Thu 31 July 2025 |
52.70 (0.94%) |
52.11 |
51.49 - 53.48 |
0.8039 times |
Mon 30 June 2025 |
52.21 (6.77%) |
48.61 |
48.50 - 52.40 |
0.5468 times |
Fri 30 May 2025 |
48.90 (8.5%) |
45.98 |
45.64 - 49.57 |
0.9805 times |
Wed 30 April 2025 |
45.07 (2.13%) |
43.86 |
37.75 - 45.25 |
1.775 times |
Mon 31 March 2025 |
44.13 (-8.29%) |
48.43 |
42.88 - 48.75 |
2.3026 times |
Fri 28 February 2025 |
48.12 (-3.22%) |
48.67 |
47.27 - 51.32 |
2.2253 times |
DMA SMA EMA moving averages of Invesco Nasdaq PNQI
DMA (daily moving average) of Invesco Nasdaq PNQI
| DMA period | DMA value | | 5 day DMA | 54.21 | | 12 day DMA | 53.23 | | 20 day DMA | 53.58 | | 35 day DMA | 54.49 | | 50 day DMA | 54.81 | | 100 day DMA | 54.38 | | 150 day DMA | 52.81 | | 200 day DMA | 50.76 | EMA (exponential moving average) of Invesco Nasdaq PNQI
| EMA period | EMA current | EMA prev | EMA prev2 | | 5 day EMA | 54.11 | 53.98 | 53.84 | | 12 day EMA | 53.8 | 53.69 | 53.59 | | 20 day EMA | 53.92 | 53.87 | 53.83 | | 35 day EMA | 54.3 | 54.29 | 54.29 | | 50 day EMA | 54.9 | 54.92 | 54.95 |
SMA (simple moving average) of Invesco Nasdaq PNQI
| SMA period | SMA current | SMA prev | SMA prev2 | | 5 day SMA | 54.21 | 54.06 | 53.91 | | 12 day SMA | 53.23 | 53.11 | 53.04 | | 20 day SMA | 53.58 | 53.62 | 53.65 | | 35 day SMA | 54.49 | 54.49 | 54.51 | | 50 day SMA | 54.81 | 54.84 | 54.88 | | 100 day SMA | 54.38 | 54.36 | 54.33 | | 150 day SMA | 52.81 | 52.75 | 52.69 | | 200 day SMA | 50.76 | 50.74 | 50.73 |
|
|
