PennantparkInvestment PNNT full analysis,charts,indicators,moving averages,SMA,DMA,EMA,ADX,MACD,RSIPennantpark Investment PNNT WideScreen charts, DMA,SMA,EMA technical analysis, forecast prediction, by indicators ADX,MACD,RSI,CCI USA stock exchange
operates under N A sector & deals in N A
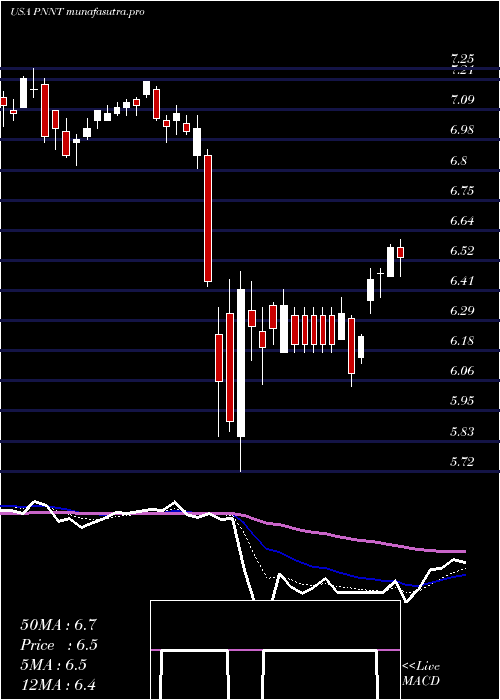
Daily price and charts and targets PennantparkInvestment Strong Daily Stock price targets for PennantparkInvestment PNNT are 6.4 and 6.5 | Daily Target 1 | 6.34 | | Daily Target 2 | 6.4 | | Daily Target 3 | 6.4433333333333 | | Daily Target 4 | 6.5 | | Daily Target 5 | 6.54 |
Daily price and volume Pennantpark Investment
| Date |
Closing |
Open |
Range |
Volume |
Mon 20 October 2025 |
6.45 (0.31%) |
6.45 |
6.39 - 6.49 |
0.7705 times |
Fri 17 October 2025 |
6.43 (0.16%) |
6.36 |
6.34 - 6.45 |
0.6356 times |
Thu 16 October 2025 |
6.42 (-1.23%) |
6.51 |
6.38 - 6.55 |
0.9391 times |
Wed 15 October 2025 |
6.50 (0.62%) |
6.50 |
6.48 - 6.60 |
0.6932 times |
Tue 07 October 2025 |
6.46 (-1.52%) |
6.60 |
6.42 - 6.65 |
1.9794 times |
Mon 06 October 2025 |
6.56 (0.15%) |
6.75 |
6.56 - 6.75 |
0.6397 times |
Fri 03 October 2025 |
6.55 (-0.61%) |
6.61 |
6.55 - 6.65 |
0.9161 times |
Thu 02 October 2025 |
6.59 (0.15%) |
6.57 |
6.53 - 6.63 |
0.8335 times |
Wed 01 October 2025 |
6.58 (-1.94%) |
6.63 |
6.58 - 6.75 |
1.3062 times |
Tue 30 September 2025 |
6.71 (0%) |
6.71 |
6.66 - 6.80 |
1.2866 times |
Mon 29 September 2025 |
6.71 (0.45%) |
6.71 |
6.61 - 6.73 |
1.339 times |
Weekly price and charts PennantparkInvestment Strong weekly Stock price targets for PennantparkInvestment PNNT are 6.4 and 6.5 | Weekly Target 1 | 6.34 | | Weekly Target 2 | 6.4 | | Weekly Target 3 | 6.4433333333333 | | Weekly Target 4 | 6.5 | | Weekly Target 5 | 6.54 |
Weekly price and volumes for Pennantpark Investment
| Date |
Closing |
Open |
Range |
Volume |
Mon 20 October 2025 |
6.45 (0.31%) |
6.45 |
6.39 - 6.49 |
0.1896 times |
Fri 17 October 2025 |
6.43 (-1.83%) |
6.75 |
6.34 - 6.75 |
1.2025 times |
Fri 03 October 2025 |
6.55 (-1.95%) |
6.71 |
6.53 - 6.80 |
1.3979 times |
Fri 26 September 2025 |
6.68 (-3.61%) |
6.90 |
6.64 - 6.92 |
1.1782 times |
Fri 19 September 2025 |
6.93 (-2.39%) |
7.05 |
6.79 - 7.06 |
1.5147 times |
Fri 12 September 2025 |
7.10 (-1.66%) |
7.23 |
7.05 - 7.28 |
1.3577 times |
Fri 05 September 2025 |
7.22 (0.7%) |
7.12 |
7.11 - 7.29 |
0.8728 times |
Fri 29 August 2025 |
7.17 (0%) |
7.21 |
7.14 - 7.23 |
0.3284 times |
Fri 29 August 2025 |
7.17 (0.28%) |
7.14 |
7.11 - 7.23 |
0.9388 times |
Fri 22 August 2025 |
7.15 (0.28%) |
7.13 |
7.03 - 7.20 |
1.0193 times |
Fri 15 August 2025 |
7.13 (-1.93%) |
7.28 |
7.10 - 7.53 |
1.8803 times |

Monthly price and charts PennantparkInvestment Strong monthly Stock price targets for PennantparkInvestment PNNT are 6.19 and 6.6 | Monthly Target 1 | 6.1 | | Monthly Target 2 | 6.28 | | Monthly Target 3 | 6.5133333333333 | | Monthly Target 4 | 6.69 | | Monthly Target 5 | 6.92 |
Monthly price and volumes Pennantpark Investment
| Date |
Closing |
Open |
Range |
Volume |
Mon 20 October 2025 |
6.45 (-3.87%) |
6.63 |
6.34 - 6.75 |
0.4464 times |
Tue 30 September 2025 |
6.71 (-6.42%) |
7.12 |
6.61 - 7.29 |
1.1597 times |
Fri 29 August 2025 |
7.17 (-0.83%) |
7.19 |
7.03 - 7.53 |
1.1016 times |
Thu 31 July 2025 |
7.23 (5.7%) |
6.86 |
6.81 - 7.45 |
0.9761 times |
Mon 30 June 2025 |
6.84 (2.7%) |
6.66 |
6.55 - 7.05 |
0.6686 times |
Fri 30 May 2025 |
6.66 (2.15%) |
6.55 |
6.34 - 6.98 |
1.1173 times |
Wed 30 April 2025 |
6.52 (-7.25%) |
7.05 |
5.72 - 7.11 |
1.4126 times |
Mon 31 March 2025 |
7.03 (-3.3%) |
7.28 |
6.88 - 7.34 |
0.9201 times |
Fri 28 February 2025 |
7.27 (2.25%) |
7.02 |
6.96 - 7.27 |
0.8223 times |
Fri 31 January 2025 |
7.11 (0.42%) |
7.05 |
6.70 - 7.29 |
1.3752 times |
Tue 31 December 2024 |
7.08 (2.46%) |
6.87 |
6.73 - 7.12 |
0.7142 times |

DMA SMA EMA moving averages of Pennantpark Investment PNNT
DMA (daily moving average) of Pennantpark Investment PNNT
| DMA period | DMA value | | 5 day DMA | 6.45 | | 12 day DMA | 6.55 | | 20 day DMA | 6.66 | | 35 day DMA | 6.88 | | 50 day DMA | 6.98 | | 100 day DMA | 6.96 | | 150 day DMA | 6.85 | | 200 day DMA | 6.91 | EMA (exponential moving average) of Pennantpark Investment PNNT
| EMA period | EMA current | EMA prev | EMA prev2 | | 5 day EMA | 6.46 | 6.47 | 6.49 | | 12 day EMA | 6.56 | 6.58 | 6.61 | | 20 day EMA | 6.65 | 6.67 | 6.7 | | 35 day EMA | 6.8 | 6.82 | 6.84 | | 50 day EMA | 6.95 | 6.97 | 6.99 |
SMA (simple moving average) of Pennantpark Investment PNNT
| SMA period | SMA current | SMA prev | SMA prev2 | | 5 day SMA | 6.45 | 6.47 | 6.5 | | 12 day SMA | 6.55 | 6.58 | 6.6 | | 20 day SMA | 6.66 | 6.69 | 6.72 | | 35 day SMA | 6.88 | 6.9 | 6.92 | | 50 day SMA | 6.98 | 6.99 | 7.01 | | 100 day SMA | 6.96 | 6.96 | 6.97 | | 150 day SMA | 6.85 | 6.85 | 6.86 | | 200 day SMA | 6.91 | 6.91 | 6.92 |
|
|
