PncFinancial PNC full analysis,charts,indicators,moving averages,SMA,DMA,EMA,ADX,MACD,RSIPnc Financial PNC WideScreen charts, DMA,SMA,EMA technical analysis, forecast prediction, by indicators ADX,MACD,RSI,CCI USA stock exchange
operates under Finance sector & deals in Major Banks
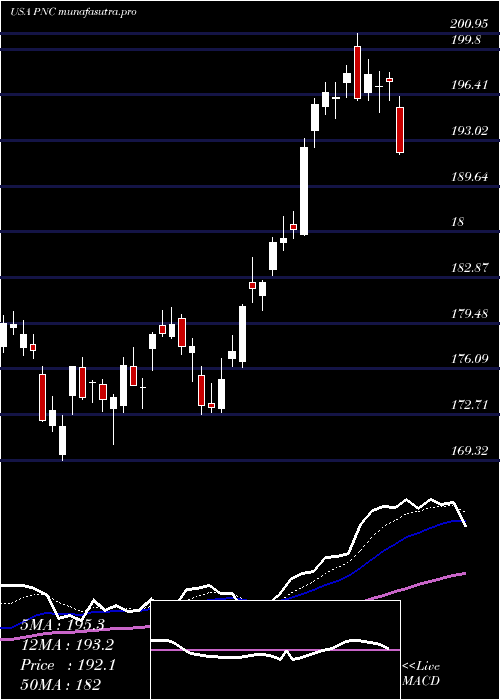
Daily price and charts and targets PncFinancial Strong Daily Stock price targets for PncFinancial PNC are 180.95 and 183.65 | Daily Target 1 | 178.74 | | Daily Target 2 | 180.45 | | Daily Target 3 | 181.43666666667 | | Daily Target 4 | 183.15 | | Daily Target 5 | 184.14 |
Daily price and volume Pnc Financial
| Date |
Closing |
Open |
Range |
Volume |
Mon 20 October 2025 |
182.17 (1.54%) |
180.22 |
179.72 - 182.42 |
0.9289 times |
Fri 17 October 2025 |
179.40 (0.51%) |
179.95 |
176.88 - 180.54 |
1.2488 times |
Thu 16 October 2025 |
178.49 (-2.11%) |
182.96 |
177.56 - 184.77 |
0.7497 times |
Wed 15 October 2025 |
182.34 (-3.9%) |
183.84 |
179.21 - 186.90 |
2.4694 times |
Tue 14 October 2025 |
189.73 (1.5%) |
184.63 |
184.50 - 190.40 |
1.2097 times |
Mon 13 October 2025 |
186.92 (1.61%) |
186.45 |
184.71 - 187.72 |
0.6738 times |
Fri 10 October 2025 |
183.95 (-3.52%) |
191.27 |
183.62 - 192.04 |
0.8187 times |
Thu 09 October 2025 |
190.67 (0.27%) |
191.16 |
188.63 - 192.25 |
0.7041 times |
Wed 08 October 2025 |
190.16 (-1.88%) |
193.87 |
190.11 - 193.87 |
0.6041 times |
Tue 07 October 2025 |
193.81 (-0.93%) |
196.16 |
192.66 - 198.93 |
0.5927 times |
Mon 06 October 2025 |
195.62 (-1.43%) |
198.90 |
194.68 - 202.00 |
0.5936 times |
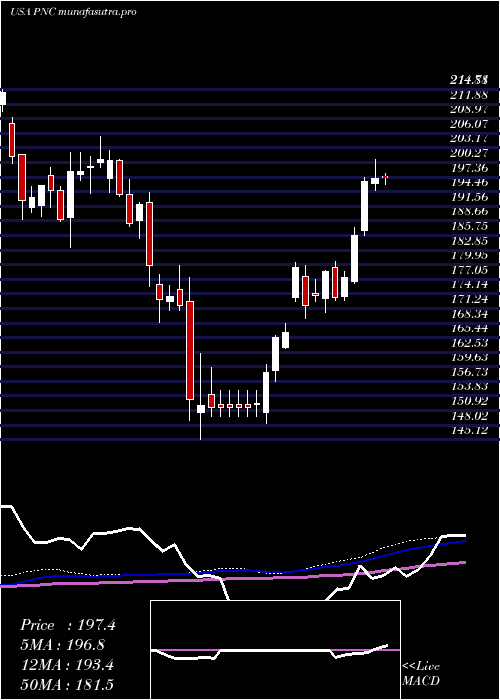
Weekly price and charts PncFinancial Strong weekly Stock price targets for PncFinancial PNC are 180.95 and 183.65 | Weekly Target 1 | 178.74 | | Weekly Target 2 | 180.45 | | Weekly Target 3 | 181.43666666667 | | Weekly Target 4 | 183.15 | | Weekly Target 5 | 184.14 |
Weekly price and volumes for Pnc Financial
| Date |
Closing |
Open |
Range |
Volume |
Mon 20 October 2025 |
182.17 (1.54%) |
180.22 |
179.72 - 182.42 |
0.3413 times |
Fri 17 October 2025 |
179.40 (-2.47%) |
186.45 |
176.88 - 190.40 |
2.3339 times |
Fri 10 October 2025 |
183.95 (-7.31%) |
198.90 |
183.62 - 202.00 |
1.2174 times |
Fri 03 October 2025 |
198.46 (-2.39%) |
203.92 |
196.62 - 204.05 |
0.8688 times |
Fri 26 September 2025 |
203.32 (-1.07%) |
204.12 |
202.15 - 206.79 |
0.8662 times |
Fri 19 September 2025 |
205.52 (1.75%) |
202.25 |
198.68 - 206.71 |
1.112 times |
Fri 12 September 2025 |
201.98 (-1.18%) |
204.21 |
198.84 - 205.64 |
0.9813 times |
Fri 05 September 2025 |
204.40 (-1.47%) |
205.71 |
202.70 - 208.80 |
0.8105 times |
Fri 29 August 2025 |
207.44 (0%) |
205.60 |
205.60 - 208.34 |
0.2786 times |
Fri 29 August 2025 |
207.44 (2.85%) |
201.30 |
200.01 - 208.34 |
1.1901 times |
Fri 22 August 2025 |
201.69 (5.45%) |
191.00 |
190.38 - 202.07 |
1.1303 times |
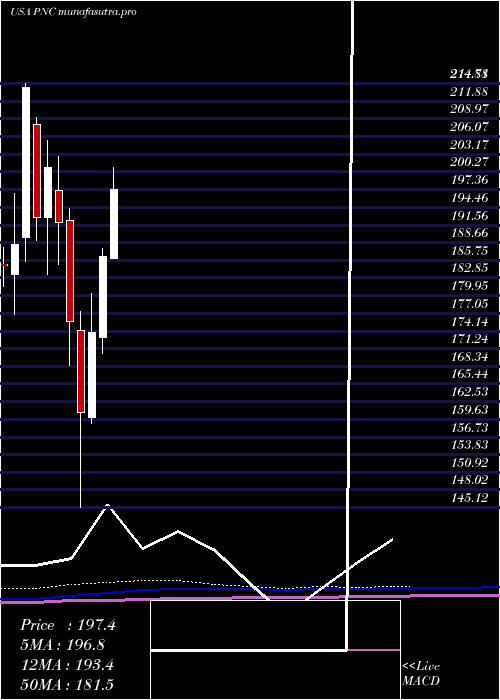
Monthly price and charts PncFinancial Strong monthly Stock price targets for PncFinancial PNC are 166.97 and 192.09 | Monthly Target 1 | 161.9 | | Monthly Target 2 | 172.03 | | Monthly Target 3 | 187.01666666667 | | Monthly Target 4 | 197.15 | | Monthly Target 5 | 212.14 |
Monthly price and volumes Pnc Financial
| Date |
Closing |
Open |
Range |
Volume |
Mon 20 October 2025 |
182.17 (-9.34%) |
199.62 |
176.88 - 202.00 |
0.7256 times |
Tue 30 September 2025 |
200.93 (-3.14%) |
205.71 |
197.40 - 208.80 |
0.7034 times |
Fri 29 August 2025 |
207.44 (9.02%) |
187.45 |
183.84 - 208.34 |
0.7756 times |
Thu 31 July 2025 |
190.27 (2.07%) |
186.04 |
186.01 - 200.95 |
1.3124 times |
Mon 30 June 2025 |
186.42 (7.26%) |
173.15 |
170.49 - 187.73 |
0.8981 times |
Fri 30 May 2025 |
173.81 (8.16%) |
159.93 |
158.92 - 180.34 |
0.9874 times |
Wed 30 April 2025 |
160.69 (-8.58%) |
174.16 |
145.12 - 177.42 |
1.3768 times |
Mon 31 March 2025 |
175.77 (-8.41%) |
192.35 |
168.44 - 194.27 |
1.1653 times |
Fri 28 February 2025 |
191.92 (-4.49%) |
197.19 |
185.10 - 202.75 |
0.7744 times |
Fri 31 January 2025 |
200.95 (4.2%) |
192.81 |
183.44 - 205.46 |
1.281 times |
Tue 31 December 2024 |
192.85 (-9.97%) |
208.00 |
189.00 - 209.16 |
0.648 times |
DMA SMA EMA moving averages of Pnc Financial PNC
DMA (daily moving average) of Pnc Financial PNC
| DMA period | DMA value | | 5 day DMA | 182.43 | | 12 day DMA | 187.64 | | 20 day DMA | 193.26 | | 35 day DMA | 197.72 | | 50 day DMA | 197.94 | | 100 day DMA | 192.42 | | 150 day DMA | 183.1 | | 200 day DMA | 185.14 | EMA (exponential moving average) of Pnc Financial PNC
| EMA period | EMA current | EMA prev | EMA prev2 | | 5 day EMA | 182.44 | 182.57 | 184.15 | | 12 day EMA | 186.96 | 187.83 | 189.36 | | 20 day EMA | 190.52 | 191.4 | 192.66 | | 35 day EMA | 193.35 | 194.01 | 194.87 | | 50 day EMA | 195.61 | 196.16 | 196.84 |
SMA (simple moving average) of Pnc Financial PNC
| SMA period | SMA current | SMA prev | SMA prev2 | | 5 day SMA | 182.43 | 183.38 | 184.29 | | 12 day SMA | 187.64 | 188.98 | 190.56 | | 20 day SMA | 193.26 | 194.31 | 195.61 | | 35 day SMA | 197.72 | 198.44 | 199.24 | | 50 day SMA | 197.94 | 198.07 | 198.28 | | 100 day SMA | 192.42 | 192.36 | 192.29 | | 150 day SMA | 183.1 | 183.04 | 183 | | 200 day SMA | 185.14 | 185.21 | 185.29 |
|
|
