PutnamManaged PMM full analysis,charts,indicators,moving averages,SMA,DMA,EMA,ADX,MACD,RSIPutnam Managed PMM WideScreen charts, DMA,SMA,EMA technical analysis, forecast prediction, by indicators ADX,MACD,RSI,CCI USA stock exchange
operates under N A sector & deals in N A
Daily price and charts and targets PutnamManaged Strong Daily Stock price targets for PutnamManaged PMM are 6.09 and 6.12 | Daily Target 1 | 6.07 | | Daily Target 2 | 6.08 | | Daily Target 3 | 6.0966666666667 | | Daily Target 4 | 6.11 | | Daily Target 5 | 6.13 |
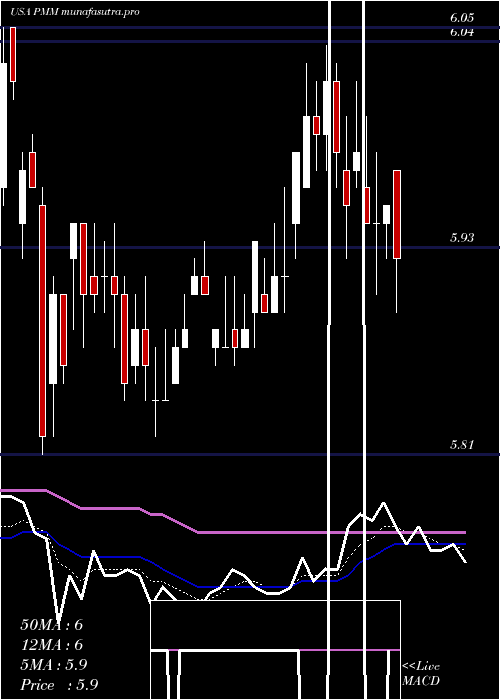
Daily price and volume Putnam Managed
| Date |
Closing |
Open |
Range |
Volume |
Mon 20 October 2025 |
6.10 (0.49%) |
6.10 |
6.08 - 6.11 |
0.7546 times |
Fri 17 October 2025 |
6.07 (-1.3%) |
6.10 |
6.07 - 6.13 |
1.3464 times |
Thu 16 October 2025 |
6.15 (0%) |
6.17 |
6.12 - 6.17 |
0.9747 times |
Wed 15 October 2025 |
6.15 (0.33%) |
6.15 |
6.15 - 6.20 |
0.9174 times |
Tue 14 October 2025 |
6.13 (0%) |
6.11 |
6.11 - 6.15 |
0.9287 times |
Mon 13 October 2025 |
6.13 (0.82%) |
6.10 |
6.10 - 6.15 |
0.8444 times |
Tue 07 October 2025 |
6.08 (0.5%) |
6.04 |
6.04 - 6.10 |
0.9039 times |
Mon 06 October 2025 |
6.05 (-0.66%) |
6.08 |
6.04 - 6.09 |
0.7485 times |
Fri 03 October 2025 |
6.09 (-0.16%) |
6.14 |
6.05 - 6.14 |
1.599 times |
Thu 02 October 2025 |
6.10 (-0.65%) |
6.14 |
6.09 - 6.14 |
0.9824 times |
Wed 01 October 2025 |
6.14 (1.66%) |
6.06 |
6.06 - 6.14 |
1.9483 times |
Weekly price and charts PutnamManaged Strong weekly Stock price targets for PutnamManaged PMM are 6.09 and 6.12 | Weekly Target 1 | 6.07 | | Weekly Target 2 | 6.08 | | Weekly Target 3 | 6.0966666666667 | | Weekly Target 4 | 6.11 | | Weekly Target 5 | 6.13 |
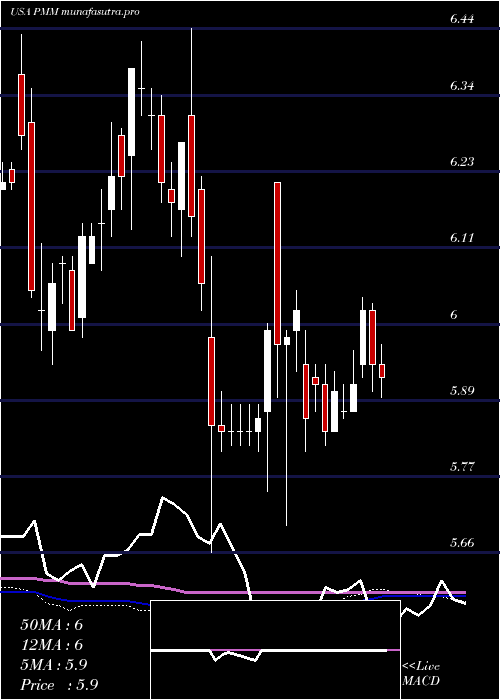
Weekly price and volumes for Putnam Managed
| Date |
Closing |
Open |
Range |
Volume |
Mon 20 October 2025 |
6.10 (0.49%) |
6.10 |
6.08 - 6.11 |
0.167 times |
Fri 17 October 2025 |
6.07 (-0.16%) |
6.10 |
6.07 - 6.20 |
1.1094 times |
Tue 07 October 2025 |
6.08 (-0.16%) |
6.08 |
6.04 - 6.10 |
0.3658 times |
Fri 03 October 2025 |
6.09 (0.5%) |
6.09 |
6.04 - 6.14 |
1.6211 times |
Fri 26 September 2025 |
6.06 (-1.62%) |
6.16 |
6.04 - 6.16 |
1.4196 times |
Fri 19 September 2025 |
6.16 (1.32%) |
6.09 |
6.08 - 6.22 |
1.2747 times |
Fri 12 September 2025 |
6.08 (1.5%) |
5.98 |
5.98 - 6.10 |
1.1735 times |
Fri 05 September 2025 |
5.99 (2.22%) |
5.84 |
5.80 - 5.99 |
0.9605 times |
Fri 29 August 2025 |
5.86 (0%) |
5.83 |
5.82 - 5.87 |
0.2125 times |
Fri 29 August 2025 |
5.86 (0%) |
5.87 |
5.78 - 5.87 |
1.696 times |
Fri 22 August 2025 |
5.86 (-1.01%) |
5.88 |
5.77 - 5.89 |
1.2871 times |
Monthly price and charts PutnamManaged Strong monthly Stock price targets for PutnamManaged PMM are 6.07 and 6.23 | Monthly Target 1 | 5.95 | | Monthly Target 2 | 6.03 | | Monthly Target 3 | 6.1133333333333 | | Monthly Target 4 | 6.19 | | Monthly Target 5 | 6.27 |
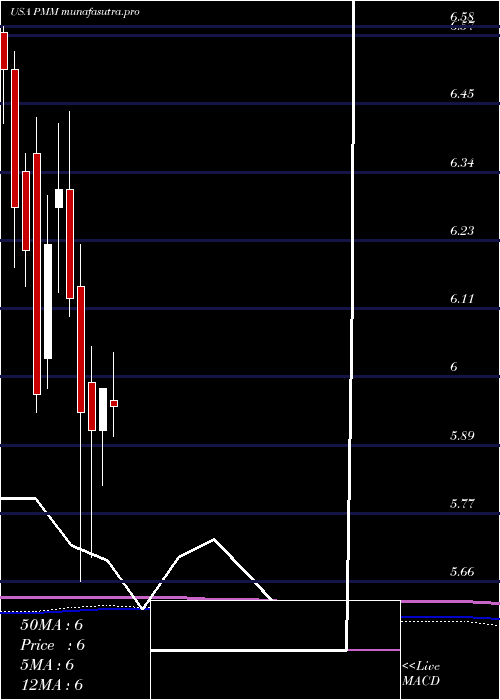
Monthly price and volumes Putnam Managed
| Date |
Closing |
Open |
Range |
Volume |
Mon 20 October 2025 |
6.10 (0.99%) |
6.06 |
6.04 - 6.20 |
0.4956 times |
Tue 30 September 2025 |
6.04 (3.07%) |
5.84 |
5.80 - 6.22 |
1.0207 times |
Fri 29 August 2025 |
5.86 (0.69%) |
5.84 |
5.77 - 5.94 |
0.9363 times |
Thu 31 July 2025 |
5.82 (-2.68%) |
5.96 |
5.77 - 6.04 |
0.8413 times |
Mon 30 June 2025 |
5.98 (1.18%) |
5.91 |
5.82 - 5.98 |
0.6416 times |
Fri 30 May 2025 |
5.91 (-0.51%) |
5.99 |
5.70 - 6.05 |
0.7457 times |
Wed 30 April 2025 |
5.94 (-3.1%) |
6.15 |
5.66 - 6.22 |
1.2592 times |
Mon 31 March 2025 |
6.13 (-2.85%) |
6.31 |
6.10 - 6.44 |
1.2324 times |
Fri 28 February 2025 |
6.31 (1.45%) |
6.28 |
6.14 - 6.42 |
1.2974 times |
Fri 31 January 2025 |
6.22 (4.19%) |
6.03 |
5.98 - 6.30 |
1.53 times |
Tue 31 December 2024 |
5.97 (-3.86%) |
6.37 |
5.94 - 6.43 |
1.3614 times |
DMA SMA EMA moving averages of Putnam Managed PMM
DMA (daily moving average) of Putnam Managed PMM
| DMA period | DMA value | | 5 day DMA | 6.12 | | 12 day DMA | 6.1 | | 20 day DMA | 6.11 | | 35 day DMA | 6.05 | | 50 day DMA | 5.99 | | 100 day DMA | 5.94 | | 150 day DMA | 5.96 | | 200 day DMA | 6.02 | EMA (exponential moving average) of Putnam Managed PMM
| EMA period | EMA current | EMA prev | EMA prev2 | | 5 day EMA | 6.11 | 6.11 | 6.13 | | 12 day EMA | 6.11 | 6.11 | 6.12 | | 20 day EMA | 6.1 | 6.1 | 6.1 | | 35 day EMA | 6.05 | 6.05 | 6.05 | | 50 day EMA | 5.99 | 5.99 | 5.99 |
SMA (simple moving average) of Putnam Managed PMM
| SMA period | SMA current | SMA prev | SMA prev2 | | 5 day SMA | 6.12 | 6.13 | 6.13 | | 12 day SMA | 6.1 | 6.1 | 6.1 | | 20 day SMA | 6.11 | 6.11 | 6.12 | | 35 day SMA | 6.05 | 6.05 | 6.04 | | 50 day SMA | 5.99 | 5.99 | 5.98 | | 100 day SMA | 5.94 | 5.94 | 5.94 | | 150 day SMA | 5.96 | 5.96 | 5.96 | | 200 day SMA | 6.02 | 6.01 | 6.01 |
|
|
