EplusInc PLUS full analysis,charts,indicators,moving averages,SMA,DMA,EMA,ADX,MACD,RSIEplus Inc PLUS WideScreen charts, DMA,SMA,EMA technical analysis, forecast prediction, by indicators ADX,MACD,RSI,CCI USA stock exchange
operates under Technology sector & deals in Retail Computer Software Peripheral Equipment
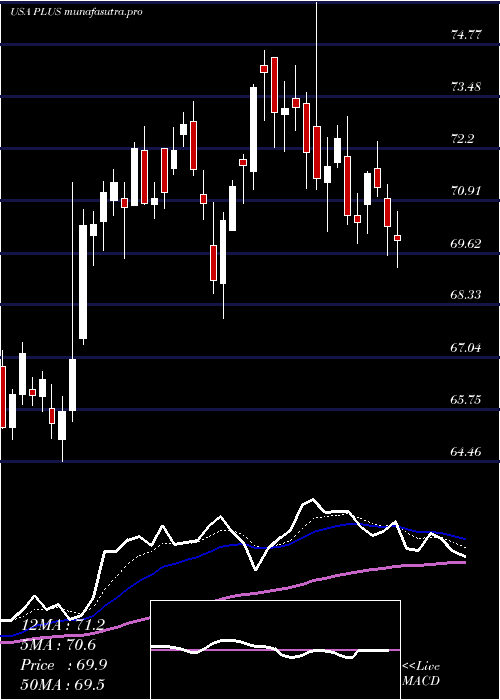
Daily price and charts and targets EplusInc Strong Daily Stock price targets for EplusInc PLUS are 72.4 and 73.8 | Daily Target 1 | 71.28 | | Daily Target 2 | 72.11 | | Daily Target 3 | 72.676666666667 | | Daily Target 4 | 73.51 | | Daily Target 5 | 74.08 |
Daily price and volume Eplus Inc
| Date |
Closing |
Open |
Range |
Volume |
Mon 20 October 2025 |
72.95 (2.2%) |
71.84 |
71.84 - 73.24 |
0.7914 times |
Fri 17 October 2025 |
71.38 (-0.01%) |
71.42 |
70.75 - 72.25 |
0.7806 times |
Thu 16 October 2025 |
71.39 (-2.65%) |
73.28 |
71.33 - 73.75 |
1.4233 times |
Wed 15 October 2025 |
73.33 (0.87%) |
73.25 |
72.72 - 74.40 |
0.8008 times |
Tue 14 October 2025 |
72.70 (3.33%) |
69.35 |
69.35 - 73.40 |
1.1817 times |
Mon 13 October 2025 |
70.36 (1.06%) |
70.07 |
70.05 - 71.29 |
1.2692 times |
Fri 10 October 2025 |
69.62 (-3.67%) |
72.30 |
69.25 - 72.48 |
0.9913 times |
Thu 09 October 2025 |
72.27 (-2.26%) |
73.78 |
71.77 - 73.78 |
0.8304 times |
Wed 08 October 2025 |
73.94 (2.07%) |
72.55 |
72.31 - 74.12 |
1.0606 times |
Tue 07 October 2025 |
72.44 (-1.27%) |
73.47 |
71.94 - 73.50 |
0.8708 times |
Mon 06 October 2025 |
73.37 (0.37%) |
73.42 |
72.84 - 73.88 |
1.0585 times |
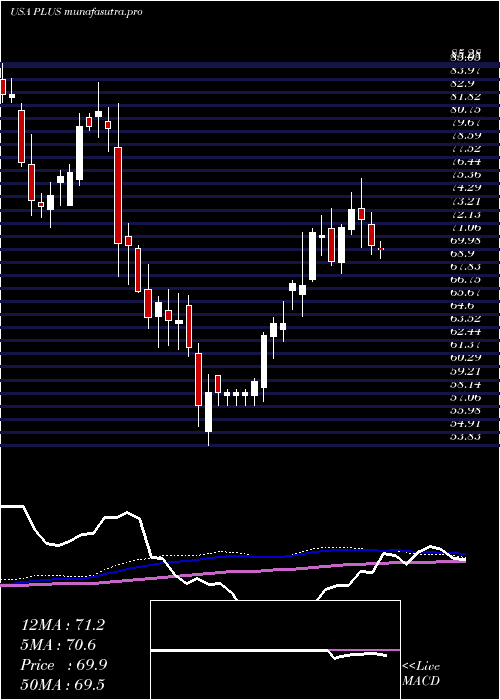
Weekly price and charts EplusInc Strong weekly Stock price targets for EplusInc PLUS are 72.4 and 73.8 | Weekly Target 1 | 71.28 | | Weekly Target 2 | 72.11 | | Weekly Target 3 | 72.676666666667 | | Weekly Target 4 | 73.51 | | Weekly Target 5 | 74.08 |
Weekly price and volumes for Eplus Inc
| Date |
Closing |
Open |
Range |
Volume |
Mon 20 October 2025 |
72.95 (2.2%) |
71.84 |
71.84 - 73.24 |
0.1682 times |
Fri 17 October 2025 |
71.38 (2.53%) |
70.07 |
69.35 - 74.40 |
1.1598 times |
Fri 10 October 2025 |
69.62 (-4.76%) |
73.42 |
69.25 - 74.12 |
1.0229 times |
Fri 03 October 2025 |
73.10 (2.05%) |
72.07 |
70.13 - 73.86 |
1.1339 times |
Fri 26 September 2025 |
71.63 (-3.31%) |
74.00 |
70.00 - 75.20 |
0.9628 times |
Fri 19 September 2025 |
74.08 (0.33%) |
74.03 |
73.07 - 77.50 |
2.3334 times |
Fri 12 September 2025 |
73.84 (4.21%) |
70.77 |
70.02 - 74.88 |
1.0567 times |
Fri 05 September 2025 |
70.86 (-2.09%) |
71.22 |
69.07 - 73.01 |
1.051 times |
Fri 29 August 2025 |
72.37 (0%) |
73.04 |
71.93 - 73.77 |
0.1773 times |
Fri 29 August 2025 |
72.37 (-1.75%) |
73.38 |
71.02 - 73.77 |
0.9339 times |
Fri 22 August 2025 |
73.66 (0.75%) |
73.45 |
70.02 - 74.30 |
0.9764 times |
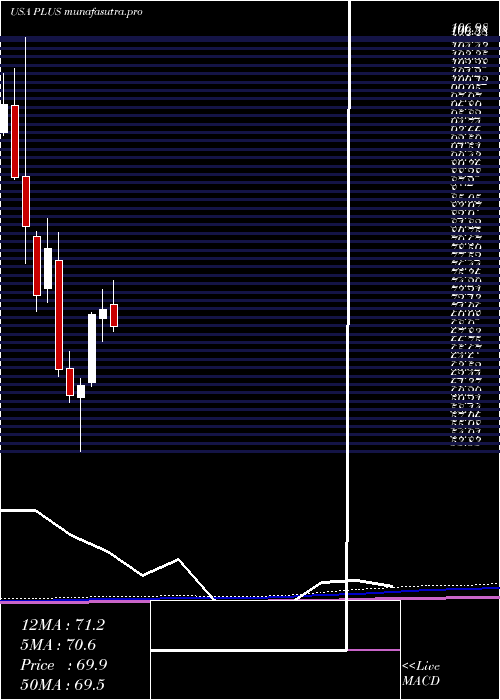
Monthly price and charts EplusInc Strong monthly Stock price targets for EplusInc PLUS are 71.1 and 76.25 | Monthly Target 1 | 67.05 | | Monthly Target 2 | 70 | | Monthly Target 3 | 72.2 | | Monthly Target 4 | 75.15 | | Monthly Target 5 | 77.35 |
Monthly price and volumes Eplus Inc
| Date |
Closing |
Open |
Range |
Volume |
Mon 20 October 2025 |
72.95 (2.73%) |
70.43 |
69.25 - 74.40 |
0.5329 times |
Tue 30 September 2025 |
71.01 (-1.88%) |
71.22 |
69.07 - 77.50 |
1.0598 times |
Fri 29 August 2025 |
72.37 (11.72%) |
63.06 |
62.20 - 75.41 |
1.0067 times |
Thu 31 July 2025 |
64.78 (-10.15%) |
72.75 |
63.83 - 75.80 |
0.9281 times |
Mon 30 June 2025 |
72.10 (1.02%) |
70.97 |
68.00 - 74.62 |
1.0267 times |
Fri 30 May 2025 |
71.37 (14.45%) |
62.71 |
62.23 - 71.68 |
0.9286 times |
Wed 30 April 2025 |
62.36 (2.18%) |
60.73 |
53.83 - 63.27 |
0.9517 times |
Mon 31 March 2025 |
61.03 (-5.2%) |
64.48 |
60.11 - 66.64 |
1.3395 times |
Fri 28 February 2025 |
64.38 (-19.42%) |
78.38 |
63.43 - 81.97 |
1.2446 times |
Fri 31 January 2025 |
79.90 (8.15%) |
74.75 |
73.01 - 83.72 |
0.9814 times |
Tue 31 December 2024 |
73.88 (-10.67%) |
81.37 |
71.76 - 82.00 |
0.8337 times |
DMA SMA EMA moving averages of Eplus Inc PLUS
DMA (daily moving average) of Eplus Inc PLUS
| DMA period | DMA value | | 5 day DMA | 72.35 | | 12 day DMA | 72.24 | | 20 day DMA | 72.04 | | 35 day DMA | 72.47 | | 50 day DMA | 72.47 | | 100 day DMA | 71.1 | | 150 day DMA | 68.16 | | 200 day DMA | 69.23 | EMA (exponential moving average) of Eplus Inc PLUS
| EMA period | EMA current | EMA prev | EMA prev2 | | 5 day EMA | 72.17 | 71.78 | 71.98 | | 12 day EMA | 72.15 | 72.01 | 72.13 | | 20 day EMA | 72.2 | 72.12 | 72.2 | | 35 day EMA | 71.98 | 71.92 | 71.95 | | 50 day EMA | 71.92 | 71.88 | 71.9 |
SMA (simple moving average) of Eplus Inc PLUS
| SMA period | SMA current | SMA prev | SMA prev2 | | 5 day SMA | 72.35 | 71.83 | 71.48 | | 12 day SMA | 72.24 | 72.23 | 72.27 | | 20 day SMA | 72.04 | 72.14 | 72.27 | | 35 day SMA | 72.47 | 72.46 | 72.49 | | 50 day SMA | 72.47 | 72.4 | 72.36 | | 100 day SMA | 71.1 | 71.08 | 71.03 | | 150 day SMA | 68.16 | 68.1 | 68.04 | | 200 day SMA | 69.23 | 69.23 | 69.24 |
|
|
