PlumasBancorp PLBC full analysis,charts,indicators,moving averages,SMA,DMA,EMA,ADX,MACD,RSIPlumas Bancorp PLBC WideScreen charts, DMA,SMA,EMA technical analysis, forecast prediction, by indicators ADX,MACD,RSI,CCI USA stock exchange
operates under Finance sector & deals in Finance Companies
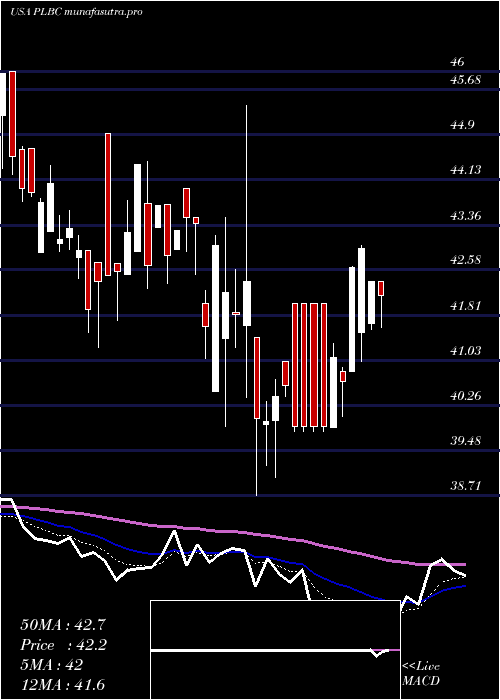
Daily price and charts and targets PlumasBancorp Strong Daily Stock price targets for PlumasBancorp PLBC are 43.6 and 44.12 | Daily Target 1 | 43.22 | | Daily Target 2 | 43.45 | | Daily Target 3 | 43.743333333333 | | Daily Target 4 | 43.97 | | Daily Target 5 | 44.26 |
Daily price and volume Plumas Bancorp
| Date |
Closing |
Open |
Range |
Volume |
Thu 04 December 2025 |
43.67 (-1.36%) |
43.65 |
43.52 - 44.04 |
0.7165 times |
Wed 03 December 2025 |
44.27 (3.05%) |
43.43 |
43.43 - 44.51 |
1.0491 times |
Tue 02 December 2025 |
42.96 (-1.45%) |
43.59 |
42.02 - 43.59 |
3.3726 times |
Mon 01 December 2025 |
43.59 (0.41%) |
43.04 |
43.04 - 43.77 |
0.5783 times |
Fri 28 November 2025 |
43.41 (-0.05%) |
43.25 |
43.05 - 43.80 |
0.6192 times |
Wed 26 November 2025 |
43.43 (0.35%) |
42.72 |
42.72 - 43.72 |
0.6602 times |
Tue 25 November 2025 |
43.28 (3%) |
42.35 |
42.35 - 43.28 |
0.7881 times |
Mon 24 November 2025 |
42.02 (-1.59%) |
42.57 |
41.87 - 42.57 |
0.3941 times |
Fri 21 November 2025 |
42.70 (3.34%) |
41.38 |
41.38 - 42.89 |
1.3153 times |
Thu 20 November 2025 |
41.32 (-0.94%) |
41.73 |
41.32 - 41.82 |
0.5067 times |
Wed 19 November 2025 |
41.71 (0.24%) |
41.50 |
41.35 - 42.33 |
0.7114 times |
Weekly price and charts PlumasBancorp Strong weekly Stock price targets for PlumasBancorp PLBC are 42.85 and 45.34 | Weekly Target 1 | 40.91 | | Weekly Target 2 | 42.29 | | Weekly Target 3 | 43.4 | | Weekly Target 4 | 44.78 | | Weekly Target 5 | 45.89 |
Weekly price and volumes for Plumas Bancorp
| Date |
Closing |
Open |
Range |
Volume |
Thu 04 December 2025 |
43.67 (0.6%) |
43.04 |
42.02 - 44.51 |
2.089 times |
Fri 28 November 2025 |
43.41 (1.66%) |
42.57 |
41.87 - 43.80 |
0.8996 times |
Fri 21 November 2025 |
42.70 (1.28%) |
42.01 |
41.30 - 42.89 |
1.1203 times |
Fri 14 November 2025 |
42.16 (1.69%) |
41.51 |
41.37 - 43.50 |
0.6901 times |
Fri 07 November 2025 |
41.46 (1.02%) |
40.94 |
40.85 - 41.70 |
0.5891 times |
Fri 31 October 2025 |
41.04 (0%) |
40.97 |
40.80 - 41.27 |
0.101 times |
Fri 31 October 2025 |
41.04 (-1.23%) |
41.95 |
39.80 - 41.95 |
0.9127 times |
Fri 24 October 2025 |
41.55 (-0.14%) |
41.62 |
41.00 - 42.61 |
1.1352 times |
Fri 17 October 2025 |
41.61 (1.44%) |
41.99 |
41.14 - 46.65 |
1.4606 times |
Fri 10 October 2025 |
41.02 (-3.39%) |
42.46 |
41.01 - 43.07 |
1.0024 times |
Fri 03 October 2025 |
42.46 (-3.48%) |
43.99 |
41.50 - 44.00 |
1.2765 times |
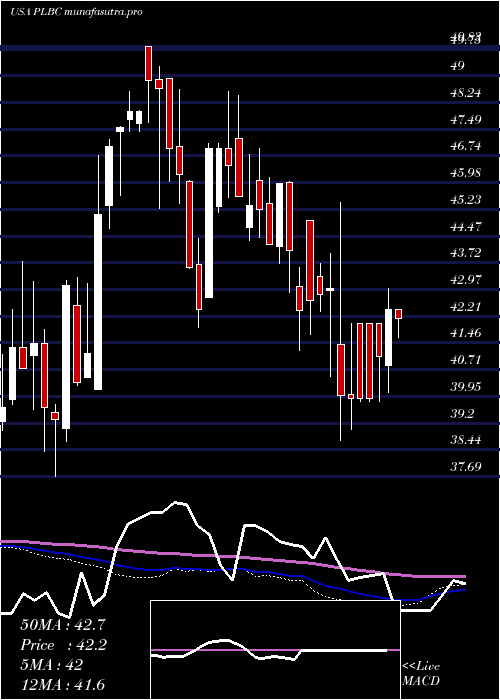
Monthly price and charts PlumasBancorp Strong monthly Stock price targets for PlumasBancorp PLBC are 42.85 and 45.34 | Monthly Target 1 | 40.91 | | Monthly Target 2 | 42.29 | | Monthly Target 3 | 43.4 | | Monthly Target 4 | 44.78 | | Monthly Target 5 | 45.89 |
Monthly price and volumes Plumas Bancorp
| Date |
Closing |
Open |
Range |
Volume |
Thu 04 December 2025 |
43.67 (0.6%) |
43.04 |
42.02 - 44.51 |
0.4397 times |
Fri 28 November 2025 |
43.41 (5.77%) |
40.94 |
40.85 - 43.80 |
0.6943 times |
Fri 31 October 2025 |
41.04 (-4.87%) |
42.84 |
39.80 - 46.65 |
1.1074 times |
Tue 30 September 2025 |
43.14 (-0.58%) |
43.15 |
42.81 - 46.59 |
1.6122 times |
Fri 29 August 2025 |
43.39 (5.16%) |
40.95 |
39.70 - 43.77 |
0.8754 times |
Thu 31 July 2025 |
41.26 (-7.2%) |
45.00 |
40.55 - 49.47 |
1.5669 times |
Mon 30 June 2025 |
44.46 (2.14%) |
42.90 |
41.21 - 45.62 |
0.8522 times |
Fri 30 May 2025 |
43.53 (-1.27%) |
41.65 |
41.65 - 46.94 |
0.9868 times |
Wed 30 April 2025 |
44.09 (1.9%) |
43.99 |
38.71 - 45.41 |
1.0468 times |
Mon 31 March 2025 |
43.27 (-5.85%) |
45.99 |
41.25 - 46.00 |
0.8183 times |
Fri 28 February 2025 |
45.96 (0.79%) |
44.70 |
43.70 - 46.94 |
0.6266 times |

DMA SMA EMA moving averages of Plumas Bancorp PLBC
DMA (daily moving average) of Plumas Bancorp PLBC
| DMA period | DMA value | | 5 day DMA | 43.58 | | 12 day DMA | 42.83 | | 20 day DMA | 42.44 | | 35 day DMA | 41.94 | | 50 day DMA | 42.11 | | 100 day DMA | 42.41 | | 150 day DMA | 43 | | 200 day DMA | 42.96 | EMA (exponential moving average) of Plumas Bancorp PLBC
| EMA period | EMA current | EMA prev | EMA prev2 | | 5 day EMA | 43.56 | 43.5 | 43.11 | | 12 day EMA | 43.04 | 42.92 | 42.68 | | 20 day EMA | 42.69 | 42.59 | 42.41 | | 35 day EMA | 42.52 | 42.45 | 42.34 | | 50 day EMA | 42.39 | 42.34 | 42.26 |
SMA (simple moving average) of Plumas Bancorp PLBC
| SMA period | SMA current | SMA prev | SMA prev2 | | 5 day SMA | 43.58 | 43.53 | 43.33 | | 12 day SMA | 42.83 | 42.65 | 42.48 | | 20 day SMA | 42.44 | 42.33 | 42.16 | | 35 day SMA | 41.94 | 41.92 | 41.87 | | 50 day SMA | 42.11 | 42.1 | 42.08 | | 100 day SMA | 42.41 | 42.42 | 42.44 | | 150 day SMA | 43 | 43.01 | 42.99 | | 200 day SMA | 42.96 | 42.97 | 42.97 |
|
|
