PhotronicsInc PLAB full analysis,charts,indicators,moving averages,SMA,DMA,EMA,ADX,MACD,RSIPhotronics Inc PLAB WideScreen charts, DMA,SMA,EMA technical analysis, forecast prediction, by indicators ADX,MACD,RSI,CCI USA stock exchange
operates under Technology sector & deals in Semiconductors
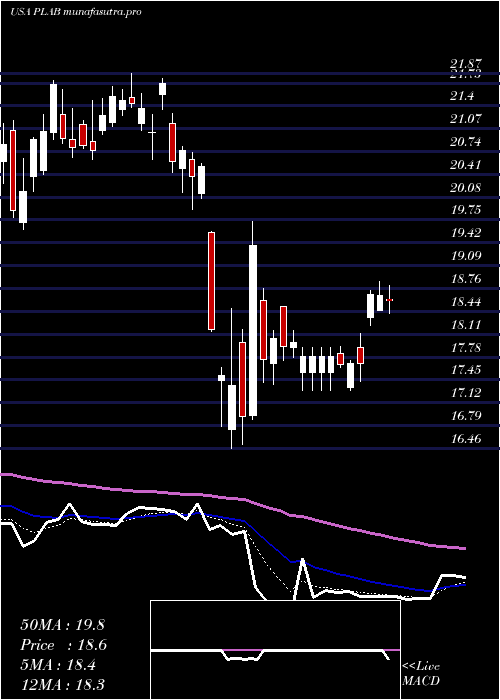
Daily price and charts and targets PhotronicsInc Strong Daily Stock price targets for PhotronicsInc PLAB are 23.9 and 25.04 | Daily Target 1 | 22.95 | | Daily Target 2 | 23.7 | | Daily Target 3 | 24.093333333333 | | Daily Target 4 | 24.84 | | Daily Target 5 | 25.23 |
Daily price and volume Photronics Inc
| Date |
Closing |
Open |
Range |
Volume |
Mon 20 October 2025 |
24.44 (5.85%) |
23.35 |
23.35 - 24.49 |
0.7063 times |
Fri 17 October 2025 |
23.09 (-1.28%) |
23.10 |
22.81 - 23.25 |
0.5143 times |
Thu 16 October 2025 |
23.39 (-0.47%) |
23.99 |
23.30 - 24.15 |
0.6274 times |
Wed 15 October 2025 |
23.50 (1.56%) |
23.69 |
22.87 - 23.73 |
0.8857 times |
Tue 14 October 2025 |
23.14 (-0.26%) |
22.58 |
22.56 - 23.48 |
0.8694 times |
Mon 13 October 2025 |
23.20 (6.32%) |
22.88 |
22.56 - 23.31 |
0.9322 times |
Fri 10 October 2025 |
21.82 (-9.05%) |
23.99 |
21.76 - 24.23 |
1.4979 times |
Thu 09 October 2025 |
23.99 (1.87%) |
23.45 |
23.03 - 24.07 |
1.0198 times |
Wed 08 October 2025 |
23.55 (1.16%) |
23.10 |
22.94 - 23.90 |
1.5857 times |
Tue 07 October 2025 |
23.28 (-7.98%) |
25.04 |
23.19 - 25.37 |
1.3613 times |
Mon 06 October 2025 |
25.30 (3.43%) |
24.40 |
24.40 - 25.56 |
0.6815 times |
Weekly price and charts PhotronicsInc Strong weekly Stock price targets for PhotronicsInc PLAB are 23.9 and 25.04 | Weekly Target 1 | 22.95 | | Weekly Target 2 | 23.7 | | Weekly Target 3 | 24.093333333333 | | Weekly Target 4 | 24.84 | | Weekly Target 5 | 25.23 |
Weekly price and volumes for Photronics Inc
| Date |
Closing |
Open |
Range |
Volume |
Mon 20 October 2025 |
24.44 (5.85%) |
23.35 |
23.35 - 24.49 |
0.1682 times |
Fri 17 October 2025 |
23.09 (5.82%) |
22.88 |
22.56 - 24.15 |
0.9121 times |
Fri 10 October 2025 |
21.82 (-10.79%) |
24.40 |
21.76 - 25.56 |
1.4641 times |
Fri 03 October 2025 |
24.46 (5.34%) |
23.51 |
22.54 - 25.09 |
1.1478 times |
Fri 26 September 2025 |
23.22 (-6.9%) |
25.10 |
23.01 - 25.51 |
0.9966 times |
Fri 19 September 2025 |
24.94 (10.7%) |
22.60 |
22.53 - 25.02 |
1.7352 times |
Fri 12 September 2025 |
22.53 (-0.49%) |
22.79 |
21.86 - 22.88 |
0.7595 times |
Fri 05 September 2025 |
22.64 (-0.13%) |
22.15 |
21.44 - 22.94 |
0.9915 times |
Fri 29 August 2025 |
22.67 (0%) |
23.34 |
22.55 - 23.50 |
0.2765 times |
Fri 29 August 2025 |
22.67 (2.67%) |
22.06 |
21.96 - 24.97 |
1.5484 times |
Fri 22 August 2025 |
22.08 (6.62%) |
20.75 |
20.43 - 22.15 |
0.5682 times |
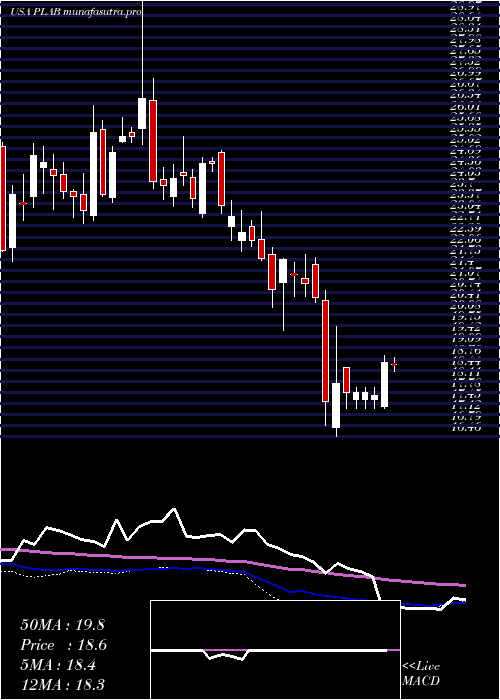
Monthly price and charts PhotronicsInc Strong monthly Stock price targets for PhotronicsInc PLAB are 23.1 and 26.9 | Monthly Target 1 | 20.12 | | Monthly Target 2 | 22.28 | | Monthly Target 3 | 23.92 | | Monthly Target 4 | 26.08 | | Monthly Target 5 | 27.72 |
Monthly price and volumes Photronics Inc
| Date |
Closing |
Open |
Range |
Volume |
Mon 20 October 2025 |
24.44 (6.49%) |
22.82 |
21.76 - 25.56 |
0.9199 times |
Tue 30 September 2025 |
22.95 (1.24%) |
22.15 |
21.44 - 25.51 |
1.3028 times |
Fri 29 August 2025 |
22.67 (11.35%) |
19.96 |
19.45 - 24.97 |
1.0037 times |
Thu 31 July 2025 |
20.36 (8.13%) |
19.03 |
18.61 - 21.85 |
0.9257 times |
Mon 30 June 2025 |
18.83 (12.69%) |
16.67 |
16.61 - 19.42 |
0.9729 times |
Fri 30 May 2025 |
16.71 (-8.54%) |
18.44 |
16.59 - 21.10 |
1.1749 times |
Wed 30 April 2025 |
18.27 (-11.99%) |
20.63 |
16.46 - 20.72 |
1.1252 times |
Mon 31 March 2025 |
20.76 (-0.38%) |
21.04 |
19.61 - 21.87 |
1.0472 times |
Fri 28 February 2025 |
20.84 (-9.35%) |
22.27 |
20.28 - 23.18 |
0.7514 times |
Fri 31 January 2025 |
22.99 (-2.42%) |
23.98 |
22.27 - 25.36 |
0.7763 times |
Tue 31 December 2024 |
23.56 (-7.1%) |
25.61 |
23.29 - 31.60 |
0.8368 times |

DMA SMA EMA moving averages of Photronics Inc PLAB
DMA (daily moving average) of Photronics Inc PLAB
| DMA period | DMA value | | 5 day DMA | 23.51 | | 12 day DMA | 23.6 | | 20 day DMA | 23.68 | | 35 day DMA | 23.39 | | 50 day DMA | 22.93 | | 100 day DMA | 21.04 | | 150 day DMA | 20.47 | | 200 day DMA | 21 | EMA (exponential moving average) of Photronics Inc PLAB
| EMA period | EMA current | EMA prev | EMA prev2 | | 5 day EMA | 23.64 | 23.24 | 23.32 | | 12 day EMA | 23.55 | 23.39 | 23.44 | | 20 day EMA | 23.49 | 23.39 | 23.42 | | 35 day EMA | 23.12 | 23.04 | 23.04 | | 50 day EMA | 22.74 | 22.67 | 22.65 |
SMA (simple moving average) of Photronics Inc PLAB
| SMA period | SMA current | SMA prev | SMA prev2 | | 5 day SMA | 23.51 | 23.26 | 23.01 | | 12 day SMA | 23.6 | 23.61 | 23.63 | | 20 day SMA | 23.68 | 23.71 | 23.8 | | 35 day SMA | 23.39 | 23.34 | 23.33 | | 50 day SMA | 22.93 | 22.84 | 22.78 | | 100 day SMA | 21.04 | 20.99 | 20.96 | | 150 day SMA | 20.47 | 20.45 | 20.43 | | 200 day SMA | 21 | 21 | 21 |
|
|
