PjtPartners PJT full analysis,charts,indicators,moving averages,SMA,DMA,EMA,ADX,MACD,RSIPjt Partners PJT WideScreen charts, DMA,SMA,EMA technical analysis, forecast prediction, by indicators ADX,MACD,RSI,CCI USA stock exchange
operates under Finance sector & deals in Investment Managers
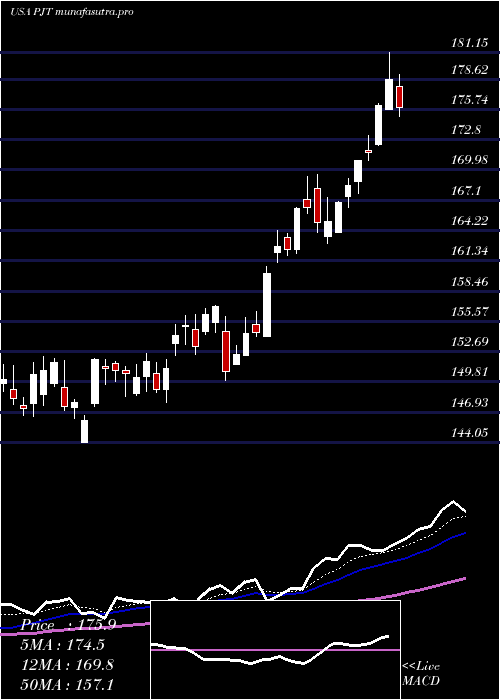
Daily price and charts and targets PjtPartners Strong Daily Stock price targets for PjtPartners PJT are 169.61 and 172.62 | Daily Target 1 | 167.23 | | Daily Target 2 | 168.98 | | Daily Target 3 | 170.23666666667 | | Daily Target 4 | 171.99 | | Daily Target 5 | 173.25 |
Daily price and volume Pjt Partners
| Date |
Closing |
Open |
Range |
Volume |
Thu 04 December 2025 |
170.74 (1.17%) |
169.93 |
168.48 - 171.49 |
1.2592 times |
Wed 03 December 2025 |
168.77 (1.96%) |
166.06 |
165.86 - 169.78 |
1.3218 times |
Tue 02 December 2025 |
165.53 (-0.56%) |
168.56 |
164.35 - 168.56 |
0.7781 times |
Mon 01 December 2025 |
166.46 (-0.92%) |
166.39 |
163.95 - 166.85 |
0.6895 times |
Fri 28 November 2025 |
168.01 (0.02%) |
168.25 |
166.73 - 168.77 |
0.3474 times |
Wed 26 November 2025 |
167.98 (-1.27%) |
168.46 |
167.82 - 171.01 |
1.0721 times |
Tue 25 November 2025 |
170.14 (3.08%) |
164.63 |
164.63 - 170.35 |
0.8568 times |
Mon 24 November 2025 |
165.05 (-1.41%) |
166.56 |
164.77 - 168.24 |
0.9629 times |
Fri 21 November 2025 |
167.41 (2.58%) |
164.60 |
164.60 - 169.70 |
1.0087 times |
Thu 20 November 2025 |
163.20 (-1.07%) |
167.29 |
163.05 - 170.24 |
1.7036 times |
Wed 19 November 2025 |
164.97 (1.92%) |
163.37 |
161.62 - 165.48 |
1.0335 times |
Weekly price and charts PjtPartners Strong weekly Stock price targets for PjtPartners PJT are 167.35 and 174.89 | Weekly Target 1 | 161.19 | | Weekly Target 2 | 165.96 | | Weekly Target 3 | 168.72666666667 | | Weekly Target 4 | 173.5 | | Weekly Target 5 | 176.27 |
Weekly price and volumes for Pjt Partners
| Date |
Closing |
Open |
Range |
Volume |
Thu 04 December 2025 |
170.74 (1.62%) |
166.39 |
163.95 - 171.49 |
1.132 times |
Fri 28 November 2025 |
168.01 (0.36%) |
166.56 |
164.63 - 171.01 |
0.9057 times |
Fri 21 November 2025 |
167.41 (0.4%) |
166.18 |
157.83 - 170.24 |
1.4529 times |
Fri 14 November 2025 |
166.75 (0.02%) |
168.68 |
164.76 - 172.97 |
1.0142 times |
Fri 07 November 2025 |
166.72 (3.48%) |
169.55 |
158.77 - 172.75 |
1.5738 times |
Fri 31 October 2025 |
161.11 (0%) |
168.29 |
160.79 - 168.29 |
0.3443 times |
Fri 31 October 2025 |
161.11 (-11.86%) |
184.20 |
160.79 - 185.67 |
1.3242 times |
Fri 24 October 2025 |
182.78 (3.17%) |
179.02 |
174.52 - 183.50 |
0.7484 times |
Fri 17 October 2025 |
177.16 (0.35%) |
171.50 |
170.77 - 177.38 |
1.0255 times |
Tue 07 October 2025 |
176.55 (-1.65%) |
180.05 |
176.47 - 182.27 |
0.479 times |
Fri 03 October 2025 |
179.51 (-1.83%) |
183.06 |
171.93 - 183.07 |
0.8185 times |
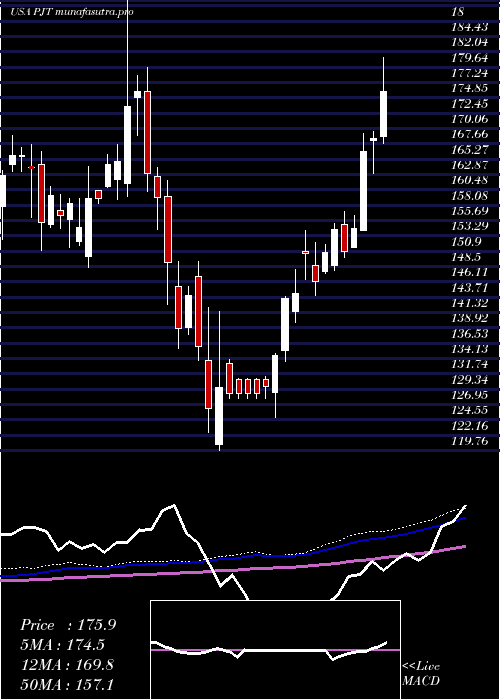
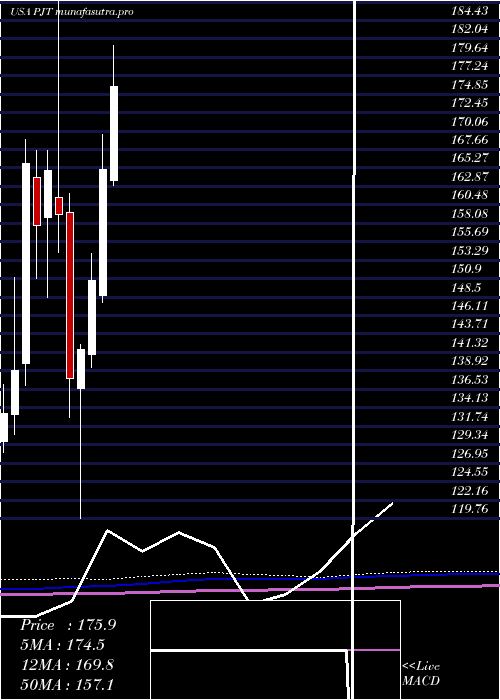
Monthly price and charts PjtPartners Strong monthly Stock price targets for PjtPartners PJT are 167.35 and 174.89 | Monthly Target 1 | 161.19 | | Monthly Target 2 | 165.96 | | Monthly Target 3 | 168.72666666667 | | Monthly Target 4 | 173.5 | | Monthly Target 5 | 176.27 |
Monthly price and volumes Pjt Partners
| Date |
Closing |
Open |
Range |
Volume |
Thu 04 December 2025 |
170.74 (1.62%) |
166.39 |
163.95 - 171.49 |
0.226 times |
Fri 28 November 2025 |
168.01 (4.28%) |
169.55 |
157.83 - 172.97 |
0.9876 times |
Fri 31 October 2025 |
161.11 (-9.35%) |
175.42 |
160.79 - 185.67 |
0.8844 times |
Tue 30 September 2025 |
177.73 (-0.71%) |
176.59 |
172.03 - 189.86 |
0.6577 times |
Fri 29 August 2025 |
179.00 (0.21%) |
173.82 |
172.00 - 186.44 |
0.911 times |
Thu 31 July 2025 |
178.62 (8.25%) |
163.69 |
162.96 - 189.18 |
1.3123 times |
Mon 30 June 2025 |
165.01 (9.52%) |
148.67 |
147.82 - 169.58 |
0.815 times |
Fri 30 May 2025 |
150.66 (6.32%) |
141.09 |
139.37 - 154.20 |
1.1892 times |
Wed 30 April 2025 |
141.71 (2.78%) |
136.67 |
119.76 - 142.31 |
1.5972 times |
Mon 31 March 2025 |
137.88 (-13.42%) |
159.51 |
132.85 - 161.91 |
1.4198 times |
Fri 28 February 2025 |
159.26 (-3.46%) |
161.43 |
154.36 - 190.28 |
1.2619 times |
DMA SMA EMA moving averages of Pjt Partners PJT
DMA (daily moving average) of Pjt Partners PJT
| DMA period | DMA value | | 5 day DMA | 167.9 | | 12 day DMA | 166.68 | | 20 day DMA | 166.66 | | 35 day DMA | 169.52 | | 50 day DMA | 172.41 | | 100 day DMA | 176.65 | | 150 day DMA | 169 | | 200 day DMA | 162.45 | EMA (exponential moving average) of Pjt Partners PJT
| EMA period | EMA current | EMA prev | EMA prev2 | | 5 day EMA | 168.45 | 167.31 | 166.58 | | 12 day EMA | 167.52 | 166.93 | 166.6 | | 20 day EMA | 167.88 | 167.58 | 167.45 | | 35 day EMA | 170.21 | 170.18 | 170.26 | | 50 day EMA | 172.95 | 173.04 | 173.21 |
SMA (simple moving average) of Pjt Partners PJT
| SMA period | SMA current | SMA prev | SMA prev2 | | 5 day SMA | 167.9 | 167.35 | 167.62 | | 12 day SMA | 166.68 | 165.69 | 165.52 | | 20 day SMA | 166.66 | 166.48 | 166.21 | | 35 day SMA | 169.52 | 169.68 | 169.86 | | 50 day SMA | 172.41 | 172.75 | 173.14 | | 100 day SMA | 176.65 | 176.73 | 176.8 | | 150 day SMA | 169 | 168.76 | 168.53 | | 200 day SMA | 162.45 | 162.47 | 162.49 |
|
|
