PutnamMaster PIM full analysis,charts,indicators,moving averages,SMA,DMA,EMA,ADX,MACD,RSIPutnam Master PIM WideScreen charts, DMA,SMA,EMA technical analysis, forecast prediction, by indicators ADX,MACD,RSI,CCI USA stock exchange
operates under N A sector & deals in N A
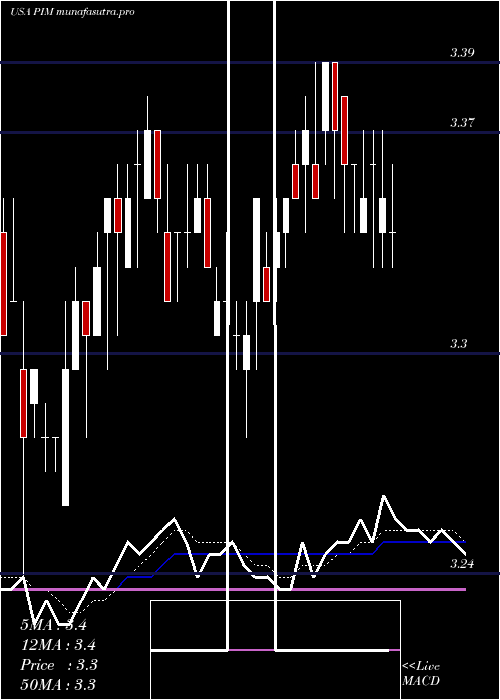
Daily price and charts and targets PutnamMaster Strong Daily Stock price targets for PutnamMaster PIM are 3.34 and 3.36 | Daily Target 1 | 3.33 | | Daily Target 2 | 3.34 | | Daily Target 3 | 3.35 | | Daily Target 4 | 3.36 | | Daily Target 5 | 3.37 |
Daily price and volume Putnam Master
| Date |
Closing |
Open |
Range |
Volume |
Tue 21 October 2025 |
3.35 (-0.3%) |
3.36 |
3.34 - 3.36 |
2.4055 times |
Mon 20 October 2025 |
3.36 (0%) |
3.36 |
3.34 - 3.37 |
0.6964 times |
Fri 17 October 2025 |
3.36 (-0.88%) |
3.34 |
3.34 - 3.38 |
0.2662 times |
Thu 16 October 2025 |
3.39 (0.3%) |
3.38 |
3.38 - 3.41 |
0.951 times |
Wed 15 October 2025 |
3.38 (-0.29%) |
3.38 |
3.37 - 3.41 |
0.9452 times |
Tue 14 October 2025 |
3.39 (-0.29%) |
3.41 |
3.35 - 3.41 |
2.2473 times |
Mon 13 October 2025 |
3.40 (-0.29%) |
3.38 |
3.38 - 3.40 |
0.4803 times |
Tue 07 October 2025 |
3.41 (0%) |
3.43 |
3.37 - 3.44 |
0.7002 times |
Mon 06 October 2025 |
3.41 (0%) |
3.43 |
3.39 - 3.43 |
0.8988 times |
Fri 03 October 2025 |
3.41 (-0.87%) |
3.45 |
3.40 - 3.45 |
0.409 times |
Thu 02 October 2025 |
3.44 (0.58%) |
3.43 |
3.41 - 3.44 |
1.2305 times |
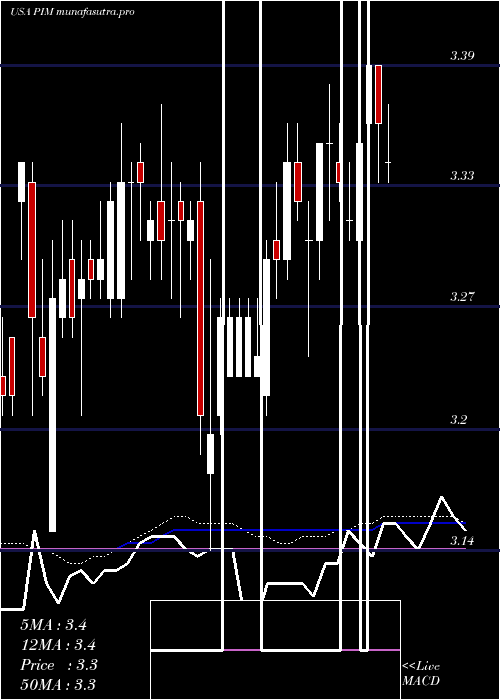
Weekly price and charts PutnamMaster Strong weekly Stock price targets for PutnamMaster PIM are 3.33 and 3.36 | Weekly Target 1 | 3.32 | | Weekly Target 2 | 3.34 | | Weekly Target 3 | 3.3533333333333 | | Weekly Target 4 | 3.37 | | Weekly Target 5 | 3.38 |
Weekly price and volumes for Putnam Master
| Date |
Closing |
Open |
Range |
Volume |
Tue 21 October 2025 |
3.35 (-0.3%) |
3.36 |
3.34 - 3.37 |
0.2605 times |
Fri 17 October 2025 |
3.36 (-1.47%) |
3.38 |
3.34 - 3.41 |
0.4108 times |
Tue 07 October 2025 |
3.41 (0%) |
3.43 |
3.37 - 3.44 |
0.1343 times |
Fri 03 October 2025 |
3.41 (-0.58%) |
3.43 |
3.39 - 3.46 |
0.4334 times |
Fri 26 September 2025 |
3.43 (-0.58%) |
3.45 |
3.42 - 3.47 |
0.6225 times |
Fri 19 September 2025 |
3.45 (-1.43%) |
3.48 |
3.44 - 3.50 |
0.8189 times |
Fri 12 September 2025 |
3.50 (3.55%) |
3.39 |
3.35 - 3.50 |
5.4848 times |
Fri 05 September 2025 |
3.38 (0.9%) |
3.35 |
3.33 - 3.39 |
0.5002 times |
Fri 29 August 2025 |
3.35 (0%) |
3.37 |
3.35 - 3.37 |
0.1 times |
Fri 29 August 2025 |
3.35 (0.9%) |
3.32 |
3.32 - 3.37 |
1.2345 times |
Fri 22 August 2025 |
3.32 (-1.19%) |
3.33 |
3.30 - 3.35 |
0.6872 times |
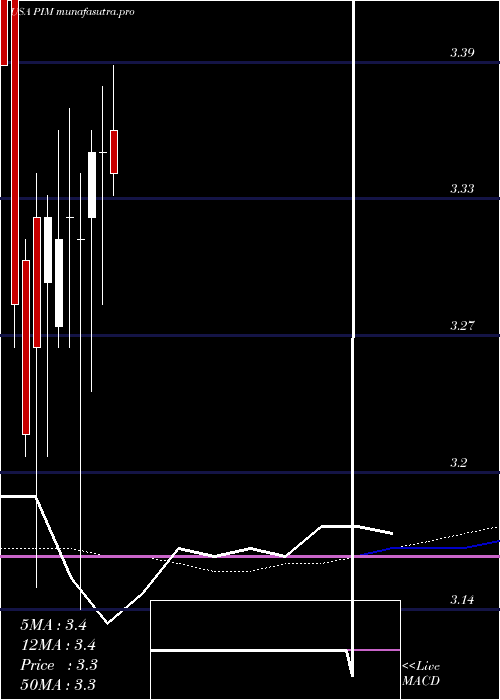
Monthly price and charts PutnamMaster Strong monthly Stock price targets for PutnamMaster PIM are 3.29 and 3.41 | Monthly Target 1 | 3.26 | | Monthly Target 2 | 3.31 | | Monthly Target 3 | 3.3833333333333 | | Monthly Target 4 | 3.43 | | Monthly Target 5 | 3.5 |
Monthly price and volumes Putnam Master
| Date |
Closing |
Open |
Range |
Volume |
Tue 21 October 2025 |
3.35 (-2.62%) |
3.42 |
3.34 - 3.46 |
0.4143 times |
Tue 30 September 2025 |
3.44 (2.69%) |
3.35 |
3.33 - 3.50 |
3.0523 times |
Fri 29 August 2025 |
3.35 (0.6%) |
3.33 |
3.30 - 3.38 |
2.0428 times |
Thu 31 July 2025 |
3.33 (-0.6%) |
3.36 |
3.28 - 3.39 |
0.5449 times |
Mon 30 June 2025 |
3.35 (0%) |
3.35 |
3.28 - 3.38 |
0.4885 times |
Fri 30 May 2025 |
3.35 (1.21%) |
3.32 |
3.24 - 3.36 |
1.2549 times |
Wed 30 April 2025 |
3.31 (-0.3%) |
3.31 |
3.14 - 3.34 |
0.5591 times |
Mon 31 March 2025 |
3.32 (0.3%) |
3.32 |
3.26 - 3.37 |
0.5644 times |
Fri 28 February 2025 |
3.31 (-0.3%) |
3.27 |
3.26 - 3.36 |
0.5321 times |
Fri 31 January 2025 |
3.32 (1.84%) |
3.29 |
3.21 - 3.33 |
0.5465 times |
Tue 31 December 2024 |
3.26 (1.24%) |
3.32 |
3.15 - 3.34 |
0.7173 times |
DMA SMA EMA moving averages of Putnam Master PIM
DMA (daily moving average) of Putnam Master PIM
| DMA period | DMA value | | 5 day DMA | 3.37 | | 12 day DMA | 3.39 | | 20 day DMA | 3.41 | | 35 day DMA | 3.42 | | 50 day DMA | 3.39 | | 100 day DMA | 3.36 | | 150 day DMA | 3.34 | | 200 day DMA | 3.33 | EMA (exponential moving average) of Putnam Master PIM
| EMA period | EMA current | EMA prev | EMA prev2 | | 5 day EMA | 3.36 | 3.37 | 3.38 | | 12 day EMA | 3.38 | 3.39 | 3.4 | | 20 day EMA | 3.4 | 3.41 | 3.41 | | 35 day EMA | 3.38 | 3.38 | 3.38 | | 50 day EMA | 3.39 | 3.39 | 3.39 |
SMA (simple moving average) of Putnam Master PIM
| SMA period | SMA current | SMA prev | SMA prev2 | | 5 day SMA | 3.37 | 3.38 | 3.38 | | 12 day SMA | 3.39 | 3.4 | 3.41 | | 20 day SMA | 3.41 | 3.42 | 3.43 | | 35 day SMA | 3.42 | 3.42 | 3.42 | | 50 day SMA | 3.39 | 3.39 | 3.39 | | 100 day SMA | 3.36 | 3.36 | 3.36 | | 150 day SMA | 3.34 | 3.34 | 3.34 | | 200 day SMA | 3.33 | 3.33 | 3.33 |
|
|
