PultegroupInc PHM full analysis,charts,indicators,moving averages,SMA,DMA,EMA,ADX,MACD,RSIPultegroup Inc PHM WideScreen charts, DMA,SMA,EMA technical analysis, forecast prediction, by indicators ADX,MACD,RSI,CCI USA stock exchange
operates under Capital Goods sector & deals in Homebuilding
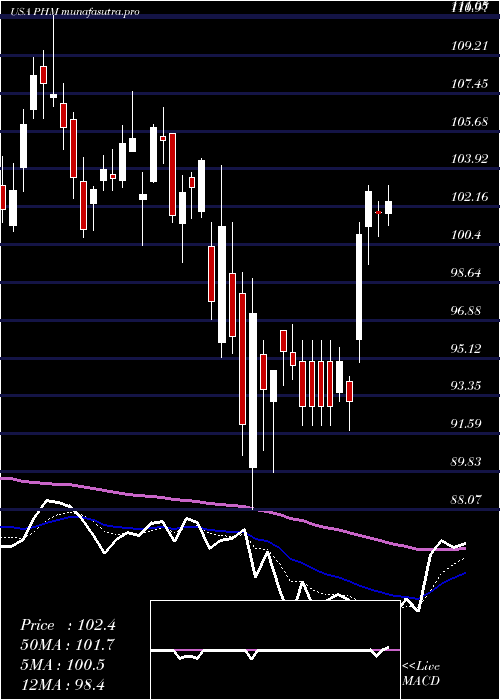
Daily price and charts and targets PultegroupInc Strong Daily Stock price targets for PultegroupInc PHM are 121.71 and 124.59 | Daily Target 1 | 121.19 | | Daily Target 2 | 122.23 | | Daily Target 3 | 124.07333333333 | | Daily Target 4 | 125.11 | | Daily Target 5 | 126.95 |
Daily price and volume Pultegroup Inc
| Date |
Closing |
Open |
Range |
Volume |
Mon 20 October 2025 |
123.26 (-0.96%) |
124.76 |
123.04 - 125.92 |
1.3472 times |
Fri 17 October 2025 |
124.45 (0.46%) |
123.71 |
122.98 - 124.94 |
1.1457 times |
Thu 16 October 2025 |
123.88 (-0.64%) |
124.68 |
121.82 - 125.02 |
1.189 times |
Wed 15 October 2025 |
124.68 (-0.17%) |
124.62 |
124.44 - 126.93 |
0.8008 times |
Tue 14 October 2025 |
124.89 (3.65%) |
119.76 |
119.40 - 125.35 |
1.2612 times |
Mon 13 October 2025 |
120.49 (-7.03%) |
120.04 |
118.61 - 120.49 |
1.2481 times |
Tue 07 October 2025 |
129.60 (-4.34%) |
132.53 |
128.50 - 132.73 |
1.3461 times |
Mon 06 October 2025 |
135.48 (-1.55%) |
138.22 |
134.15 - 138.22 |
0.4403 times |
Fri 03 October 2025 |
137.61 (2.41%) |
135.24 |
135.10 - 138.33 |
0.7755 times |
Thu 02 October 2025 |
134.37 (-0.05%) |
134.95 |
132.65 - 135.21 |
0.446 times |
Wed 01 October 2025 |
134.44 (1.75%) |
133.17 |
132.13 - 134.96 |
0.7592 times |
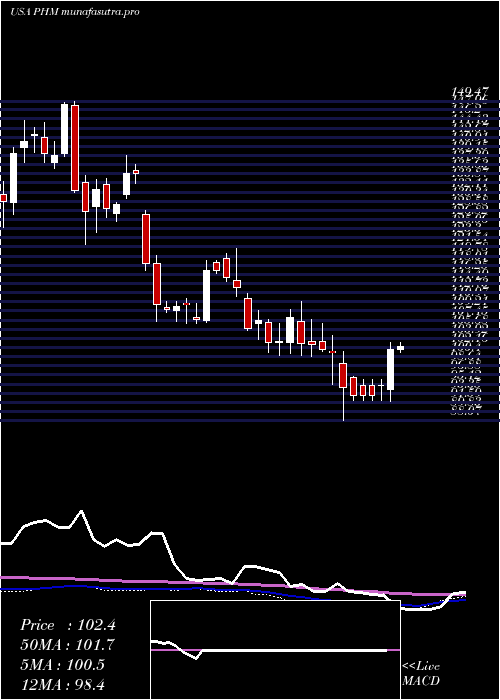
Weekly price and charts PultegroupInc Strong weekly Stock price targets for PultegroupInc PHM are 121.71 and 124.59 | Weekly Target 1 | 121.19 | | Weekly Target 2 | 122.23 | | Weekly Target 3 | 124.07333333333 | | Weekly Target 4 | 125.11 | | Weekly Target 5 | 126.95 |
Weekly price and volumes for Pultegroup Inc
| Date |
Closing |
Open |
Range |
Volume |
Mon 20 October 2025 |
123.26 (-0.96%) |
124.76 |
123.04 - 125.92 |
0.3647 times |
Fri 17 October 2025 |
124.45 (-3.97%) |
120.04 |
118.61 - 126.93 |
1.5283 times |
Tue 07 October 2025 |
129.60 (-5.82%) |
138.22 |
128.50 - 138.22 |
0.4836 times |
Fri 03 October 2025 |
137.61 (4.93%) |
131.88 |
130.15 - 138.33 |
0.9359 times |
Fri 26 September 2025 |
131.15 (-0.57%) |
131.27 |
128.18 - 132.66 |
1.097 times |
Fri 19 September 2025 |
131.90 (-3.79%) |
137.83 |
130.46 - 139.05 |
1.8425 times |
Fri 12 September 2025 |
137.10 (-2.47%) |
139.75 |
134.21 - 141.79 |
1.3249 times |
Fri 05 September 2025 |
140.57 (6.48%) |
129.90 |
129.33 - 142.11 |
1.0321 times |
Fri 29 August 2025 |
132.02 (0%) |
131.48 |
130.35 - 132.17 |
0.1744 times |
Fri 29 August 2025 |
132.02 (-0.23%) |
131.16 |
129.59 - 132.89 |
1.2167 times |
Fri 22 August 2025 |
132.33 (2.83%) |
128.78 |
123.24 - 133.67 |
1.2756 times |
Monthly price and charts PultegroupInc Strong monthly Stock price targets for PultegroupInc PHM are 111.08 and 130.8 | Monthly Target 1 | 107.01 | | Monthly Target 2 | 115.14 | | Monthly Target 3 | 126.73333333333 | | Monthly Target 4 | 134.86 | | Monthly Target 5 | 146.45 |
Monthly price and volumes Pultegroup Inc
| Date |
Closing |
Open |
Range |
Volume |
Mon 20 October 2025 |
123.26 (-6.71%) |
133.17 |
118.61 - 138.33 |
0.5394 times |
Tue 30 September 2025 |
132.13 (0.08%) |
129.90 |
128.18 - 142.11 |
1.0548 times |
Fri 29 August 2025 |
132.02 (16.91%) |
115.06 |
114.43 - 133.67 |
0.9796 times |
Thu 31 July 2025 |
112.92 (7.07%) |
104.87 |
104.04 - 122.49 |
1.2672 times |
Mon 30 June 2025 |
105.46 (7.58%) |
96.99 |
95.20 - 107.90 |
0.8496 times |
Fri 30 May 2025 |
98.03 (-4.44%) |
102.84 |
97.01 - 108.81 |
0.9027 times |
Wed 30 April 2025 |
102.58 (-0.21%) |
103.52 |
88.07 - 104.39 |
1.0525 times |
Mon 31 March 2025 |
102.80 (-0.46%) |
103.14 |
99.58 - 111.05 |
1.1283 times |
Fri 28 February 2025 |
103.28 (-9.23%) |
111.51 |
100.54 - 112.64 |
1.0221 times |
Fri 31 January 2025 |
113.78 (4.48%) |
110.18 |
106.81 - 121.31 |
1.2037 times |
Tue 31 December 2024 |
108.90 (-19.69%) |
127.78 |
107.21 - 128.59 |
0.784 times |

DMA SMA EMA moving averages of Pultegroup Inc PHM
DMA (daily moving average) of Pultegroup Inc PHM
| DMA period | DMA value | | 5 day DMA | 124.23 | | 12 day DMA | 128.77 | | 20 day DMA | 129.73 | | 35 day DMA | 132.16 | | 50 day DMA | 130.72 | | 100 day DMA | 119.11 | | 150 day DMA | 112.93 | | 200 day DMA | 112.06 | EMA (exponential moving average) of Pultegroup Inc PHM
| EMA period | EMA current | EMA prev | EMA prev2 | | 5 day EMA | 124.61 | 125.29 | 125.71 | | 12 day EMA | 127.2 | 127.92 | 128.55 | | 20 day EMA | 128.73 | 129.31 | 129.82 | | 35 day EMA | 128.95 | 129.29 | 129.57 | | 50 day EMA | 128.94 | 129.17 | 129.36 |
SMA (simple moving average) of Pultegroup Inc PHM
| SMA period | SMA current | SMA prev | SMA prev2 | | 5 day SMA | 124.23 | 123.68 | 124.71 | | 12 day SMA | 128.77 | 129.6 | 130.16 | | 20 day SMA | 129.73 | 130.27 | 130.74 | | 35 day SMA | 132.16 | 132.38 | 132.58 | | 50 day SMA | 130.72 | 130.66 | 130.59 | | 100 day SMA | 119.11 | 118.86 | 118.63 | | 150 day SMA | 112.93 | 112.82 | 112.7 | | 200 day SMA | 112.06 | 111.99 | 111.92 |
|
|
