PldtInc PHI full analysis,charts,indicators,moving averages,SMA,DMA,EMA,ADX,MACD,RSIPldt Inc PHI WideScreen charts, DMA,SMA,EMA technical analysis, forecast prediction, by indicators ADX,MACD,RSI,CCI USA stock exchange
operates under Public Utilities sector & deals in Telecommunications Equipment
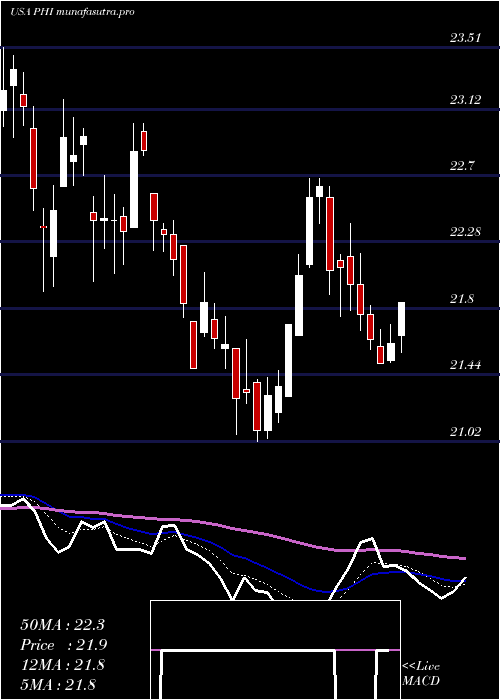
Daily price and charts and targets PldtInc Strong Daily Stock price targets for PldtInc PHI are 18.98 and 19.68 | Daily Target 1 | 18.45 | | Daily Target 2 | 18.81 | | Daily Target 3 | 19.153333333333 | | Daily Target 4 | 19.51 | | Daily Target 5 | 19.85 |
Daily price and volume Pldt Inc
| Date |
Closing |
Open |
Range |
Volume |
Tue 21 October 2025 |
19.16 (1.05%) |
18.90 |
18.80 - 19.50 |
1.005 times |
Mon 20 October 2025 |
18.96 (0%) |
19.05 |
18.81 - 19.05 |
0.8526 times |
Fri 17 October 2025 |
18.96 (0%) |
18.90 |
18.89 - 19.07 |
1.0872 times |
Thu 16 October 2025 |
18.96 (0.42%) |
18.95 |
18.66 - 18.99 |
1.1365 times |
Wed 15 October 2025 |
18.88 (-0.58%) |
19.01 |
18.83 - 19.12 |
0.8881 times |
Tue 14 October 2025 |
18.99 (-0.26%) |
19.00 |
18.85 - 19.12 |
1.0846 times |
Mon 13 October 2025 |
19.04 (0.11%) |
19.00 |
18.84 - 19.13 |
1.1651 times |
Tue 07 October 2025 |
19.02 (0.79%) |
19.00 |
18.81 - 19.24 |
0.889 times |
Mon 06 October 2025 |
18.87 (-0.68%) |
19.00 |
18.69 - 19.02 |
0.9389 times |
Fri 03 October 2025 |
19.00 (1.71%) |
18.85 |
18.85 - 19.08 |
0.953 times |
Thu 02 October 2025 |
18.68 (-0.69%) |
18.87 |
18.66 - 19.04 |
0.8322 times |
Weekly price and charts PldtInc Strong weekly Stock price targets for PldtInc PHI are 18.98 and 19.68 | Weekly Target 1 | 18.45 | | Weekly Target 2 | 18.81 | | Weekly Target 3 | 19.153333333333 | | Weekly Target 4 | 19.51 | | Weekly Target 5 | 19.85 |
Weekly price and volumes for Pldt Inc
| Date |
Closing |
Open |
Range |
Volume |
Tue 21 October 2025 |
19.16 (1.05%) |
19.05 |
18.80 - 19.50 |
0.3901 times |
Fri 17 October 2025 |
18.96 (-0.32%) |
19.00 |
18.66 - 19.13 |
1.1261 times |
Tue 07 October 2025 |
19.02 (0.11%) |
19.00 |
18.69 - 19.24 |
0.3839 times |
Fri 03 October 2025 |
19.00 (-0.21%) |
19.05 |
18.61 - 19.08 |
1.0814 times |
Fri 26 September 2025 |
19.04 (-2.41%) |
19.67 |
18.86 - 19.76 |
1.1097 times |
Fri 19 September 2025 |
19.51 (0%) |
19.67 |
19.46 - 19.96 |
1.4904 times |
Fri 12 September 2025 |
19.51 (0.1%) |
19.43 |
19.35 - 19.71 |
1.3352 times |
Fri 05 September 2025 |
19.49 (-4.83%) |
20.39 |
19.22 - 20.39 |
1.2857 times |
Fri 29 August 2025 |
20.48 (0%) |
20.66 |
20.33 - 20.66 |
0.1878 times |
Fri 29 August 2025 |
20.48 (-11.15%) |
23.07 |
20.22 - 23.30 |
1.6097 times |
Fri 22 August 2025 |
23.05 (1.01%) |
22.75 |
22.41 - 23.07 |
0.4781 times |
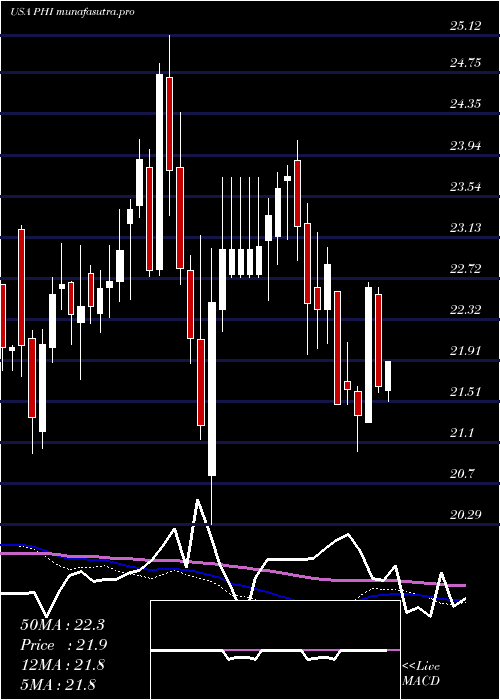
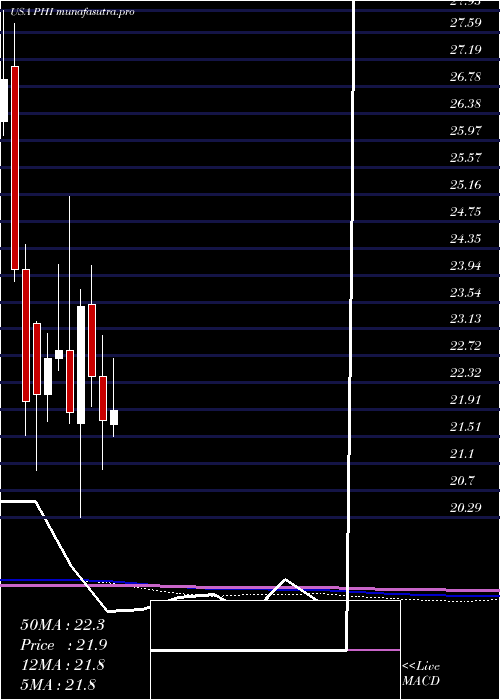
Monthly price and charts PldtInc Strong monthly Stock price targets for PldtInc PHI are 18.91 and 19.75 | Monthly Target 1 | 18.27 | | Monthly Target 2 | 18.71 | | Monthly Target 3 | 19.106666666667 | | Monthly Target 4 | 19.55 | | Monthly Target 5 | 19.95 |
Monthly price and volumes Pldt Inc
| Date |
Closing |
Open |
Range |
Volume |
Tue 21 October 2025 |
19.16 (2.46%) |
18.80 |
18.66 - 19.50 |
0.8817 times |
Tue 30 September 2025 |
18.70 (-8.69%) |
20.39 |
18.61 - 20.39 |
1.9203 times |
Fri 29 August 2025 |
20.48 (-11.27%) |
23.20 |
20.22 - 23.46 |
1.1612 times |
Thu 31 July 2025 |
23.08 (6.07%) |
21.69 |
21.51 - 23.43 |
0.883 times |
Mon 30 June 2025 |
21.76 (-2.94%) |
22.42 |
21.02 - 23.03 |
0.8764 times |
Fri 30 May 2025 |
22.42 (-4.47%) |
23.50 |
21.97 - 24.09 |
0.7376 times |
Wed 30 April 2025 |
23.47 (7.32%) |
21.71 |
20.29 - 23.72 |
1.1596 times |
Mon 31 March 2025 |
21.87 (-4.08%) |
22.81 |
21.70 - 25.12 |
0.9533 times |
Fri 28 February 2025 |
22.80 (0.48%) |
22.69 |
22.50 - 24.10 |
0.6751 times |
Fri 31 January 2025 |
22.69 (2.44%) |
22.15 |
21.73 - 23.07 |
0.7519 times |
Tue 31 December 2024 |
22.15 (0.5%) |
23.21 |
21.00 - 23.25 |
0.9457 times |
DMA SMA EMA moving averages of Pldt Inc PHI
DMA (daily moving average) of Pldt Inc PHI
| DMA period | DMA value | | 5 day DMA | 18.98 | | 12 day DMA | 18.94 | | 20 day DMA | 19.03 | | 35 day DMA | 19.3 | | 50 day DMA | 20.26 | | 100 day DMA | 21.29 | | 150 day DMA | 21.83 | | 200 day DMA | 22.16 | EMA (exponential moving average) of Pldt Inc PHI
| EMA period | EMA current | EMA prev | EMA prev2 | | 5 day EMA | 19.02 | 18.95 | 18.95 | | 12 day EMA | 19.02 | 18.99 | 19 | | 20 day EMA | 19.17 | 19.17 | 19.19 | | 35 day EMA | 19.75 | 19.79 | 19.84 | | 50 day EMA | 20.37 | 20.42 | 20.48 |
SMA (simple moving average) of Pldt Inc PHI
| SMA period | SMA current | SMA prev | SMA prev2 | | 5 day SMA | 18.98 | 18.95 | 18.97 | | 12 day SMA | 18.94 | 18.91 | 18.89 | | 20 day SMA | 19.03 | 19.05 | 19.09 | | 35 day SMA | 19.3 | 19.34 | 19.38 | | 50 day SMA | 20.26 | 20.35 | 20.42 | | 100 day SMA | 21.29 | 21.32 | 21.35 | | 150 day SMA | 21.83 | 21.86 | 21.9 | | 200 day SMA | 22.16 | 22.18 | 22.19 |
|
|
