KoninklijkePhilips PHG full analysis,charts,indicators,moving averages,SMA,DMA,EMA,ADX,MACD,RSIKoninklijke Philips PHG WideScreen charts, DMA,SMA,EMA technical analysis, forecast prediction, by indicators ADX,MACD,RSI,CCI USA stock exchange
operates under Energy sector & deals in Consumer Electronics Appliances
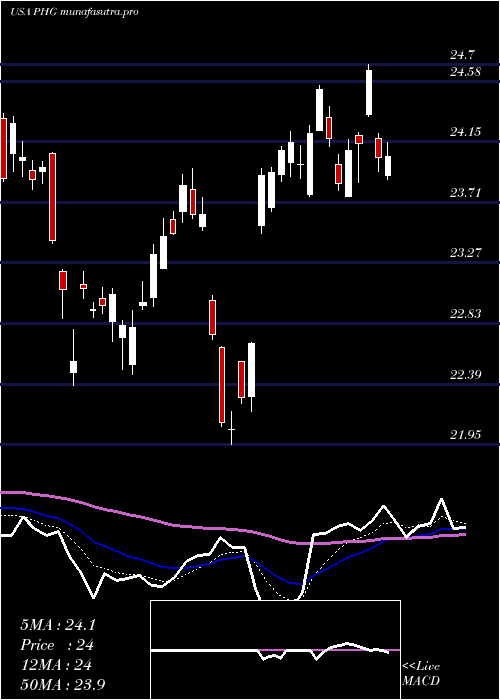
Daily price and charts and targets KoninklijkePhilips Strong Daily Stock price targets for KoninklijkePhilips PHG are 26.48 and 26.85 | Daily Target 1 | 26.17 | | Daily Target 2 | 26.42 | | Daily Target 3 | 26.543333333333 | | Daily Target 4 | 26.79 | | Daily Target 5 | 26.91 |
Daily price and volume Koninklijke Philips
| Date |
Closing |
Open |
Range |
Volume |
Thu 04 December 2025 |
26.66 (-4.92%) |
26.43 |
26.30 - 26.67 |
2.154 times |
Wed 03 December 2025 |
28.04 (-0.67%) |
28.08 |
28.01 - 28.32 |
0.6926 times |
Tue 02 December 2025 |
28.23 (-0.32%) |
28.17 |
28.07 - 28.27 |
0.5781 times |
Mon 01 December 2025 |
28.32 (0.57%) |
28.37 |
28.32 - 28.58 |
0.9524 times |
Fri 28 November 2025 |
28.16 (0.32%) |
28.01 |
27.95 - 28.21 |
0.3609 times |
Wed 26 November 2025 |
28.07 (0.79%) |
27.85 |
27.82 - 28.21 |
0.8892 times |
Tue 25 November 2025 |
27.85 (1.75%) |
27.57 |
27.57 - 27.88 |
0.8515 times |
Mon 24 November 2025 |
27.37 (0.4%) |
27.31 |
27.27 - 27.46 |
0.9042 times |
Fri 21 November 2025 |
27.26 (2.06%) |
26.73 |
26.64 - 27.43 |
1.4009 times |
Thu 20 November 2025 |
26.71 (-1.29%) |
27.10 |
26.68 - 27.22 |
1.2163 times |
Wed 19 November 2025 |
27.06 (-1.56%) |
27.31 |
26.91 - 27.34 |
0.6469 times |
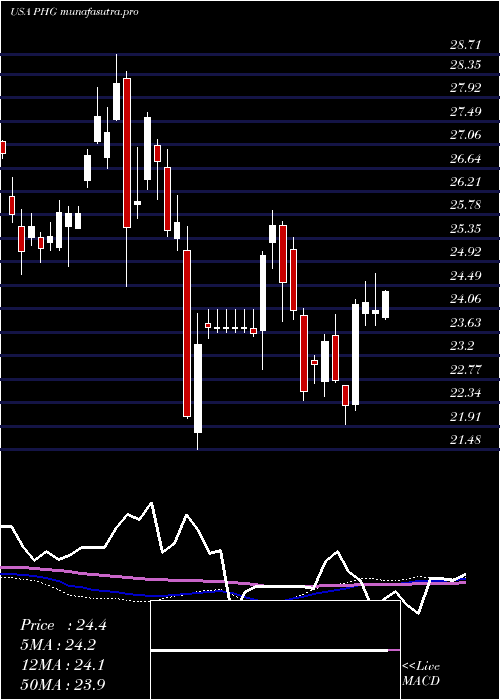
Weekly price and charts KoninklijkePhilips Strong weekly Stock price targets for KoninklijkePhilips PHG are 25.34 and 27.62 | Weekly Target 1 | 24.9 | | Weekly Target 2 | 25.78 | | Weekly Target 3 | 27.18 | | Weekly Target 4 | 28.06 | | Weekly Target 5 | 29.46 |
Weekly price and volumes for Koninklijke Philips
| Date |
Closing |
Open |
Range |
Volume |
Thu 04 December 2025 |
26.66 (-5.33%) |
28.37 |
26.30 - 28.58 |
0.8748 times |
Fri 28 November 2025 |
28.16 (3.3%) |
27.31 |
27.27 - 28.21 |
0.6007 times |
Fri 21 November 2025 |
27.26 (-4.92%) |
28.16 |
26.64 - 28.30 |
1.0276 times |
Fri 14 November 2025 |
28.67 (1.77%) |
28.34 |
28.10 - 29.54 |
1.0673 times |
Fri 07 November 2025 |
28.17 (3.11%) |
28.20 |
27.83 - 28.52 |
1.676 times |
Fri 31 October 2025 |
27.32 (0%) |
27.27 |
27.17 - 27.51 |
0.2639 times |
Fri 31 October 2025 |
27.32 (-5.24%) |
29.16 |
26.13 - 29.29 |
2.6817 times |
Fri 24 October 2025 |
28.83 (1.09%) |
28.39 |
28.31 - 29.06 |
0.8259 times |
Fri 17 October 2025 |
28.52 (2.48%) |
27.51 |
26.89 - 28.56 |
0.7257 times |
Tue 07 October 2025 |
27.83 (-0.61%) |
28.06 |
27.80 - 28.34 |
0.2564 times |
Fri 03 October 2025 |
28.00 (4.4%) |
26.89 |
26.87 - 28.07 |
1.0593 times |
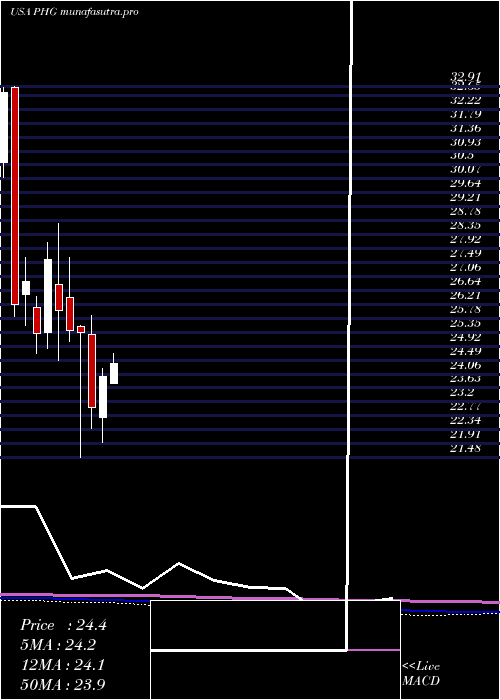
Monthly price and charts KoninklijkePhilips Strong monthly Stock price targets for KoninklijkePhilips PHG are 25.34 and 27.62 | Monthly Target 1 | 24.9 | | Monthly Target 2 | 25.78 | | Monthly Target 3 | 27.18 | | Monthly Target 4 | 28.06 | | Monthly Target 5 | 29.46 |
Monthly price and volumes Koninklijke Philips
| Date |
Closing |
Open |
Range |
Volume |
Thu 04 December 2025 |
26.66 (-5.33%) |
28.37 |
26.30 - 28.58 |
0.1625 times |
Fri 28 November 2025 |
28.16 (3.07%) |
28.20 |
26.64 - 29.54 |
0.8119 times |
Fri 31 October 2025 |
27.32 (0.22%) |
27.52 |
26.13 - 29.29 |
0.9984 times |
Tue 30 September 2025 |
27.26 (-1.16%) |
27.06 |
26.47 - 28.66 |
0.775 times |
Fri 29 August 2025 |
27.58 (5.27%) |
26.64 |
26.17 - 28.37 |
0.9957 times |
Thu 31 July 2025 |
26.20 (9.26%) |
23.76 |
23.75 - 28.45 |
1.5251 times |
Mon 30 June 2025 |
23.98 (4.08%) |
22.73 |
21.95 - 24.22 |
1.2188 times |
Fri 30 May 2025 |
23.04 (-9.11%) |
25.29 |
22.38 - 25.86 |
1.5227 times |
Wed 30 April 2025 |
25.35 (-0.2%) |
25.53 |
21.48 - 25.56 |
1.2573 times |
Mon 31 March 2025 |
25.40 (-2.42%) |
26.42 |
25.06 - 27.65 |
0.7326 times |
Fri 28 February 2025 |
26.03 (-5.62%) |
26.82 |
24.46 - 28.71 |
1.14 times |
DMA SMA EMA moving averages of Koninklijke Philips PHG
DMA (daily moving average) of Koninklijke Philips PHG
| DMA period | DMA value | | 5 day DMA | 27.88 | | 12 day DMA | 27.6 | | 20 day DMA | 28.01 | | 35 day DMA | 28.06 | | 50 day DMA | 27.89 | | 100 day DMA | 27.38 | | 150 day DMA | 26.19 | | 200 day DMA | 25.92 | EMA (exponential moving average) of Koninklijke Philips PHG
| EMA period | EMA current | EMA prev | EMA prev2 | | 5 day EMA | 27.6 | 28.07 | 28.09 | | 12 day EMA | 27.79 | 27.99 | 27.98 | | 20 day EMA | 27.86 | 27.99 | 27.99 | | 35 day EMA | 27.9 | 27.97 | 27.97 | | 50 day EMA | 27.9 | 27.95 | 27.95 |
SMA (simple moving average) of Koninklijke Philips PHG
| SMA period | SMA current | SMA prev | SMA prev2 | | 5 day SMA | 27.88 | 28.16 | 28.13 | | 12 day SMA | 27.6 | 27.71 | 27.76 | | 20 day SMA | 28.01 | 28.08 | 28.08 | | 35 day SMA | 28.06 | 28.09 | 28.07 | | 50 day SMA | 27.89 | 27.92 | 27.93 | | 100 day SMA | 27.38 | 27.36 | 27.33 | | 150 day SMA | 26.19 | 26.18 | 26.16 | | 200 day SMA | 25.92 | 25.93 | 25.93 |
|
|
